Fig. 2.
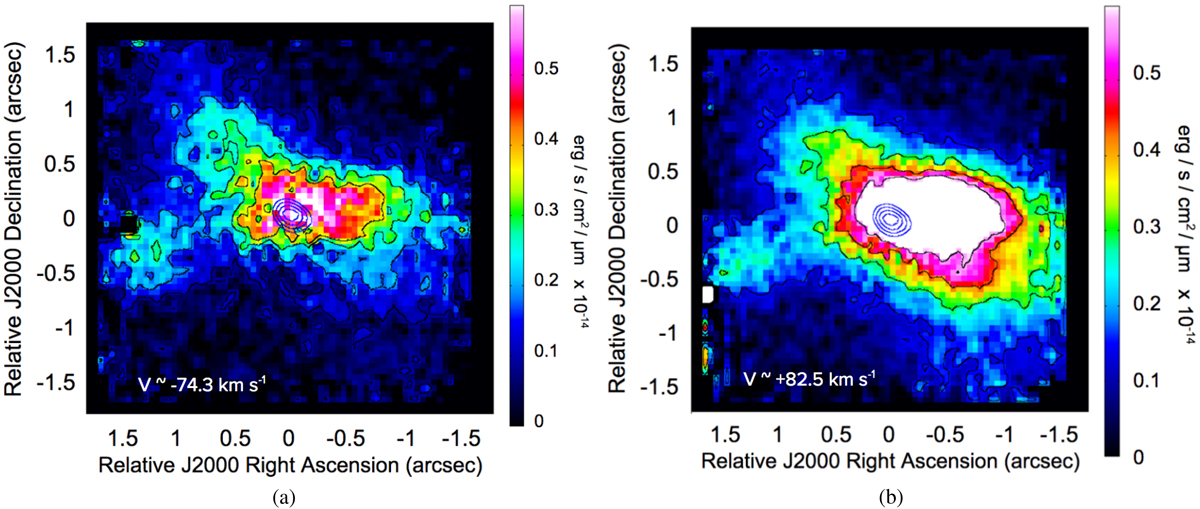
Panel a: blueshifted component of the H2 emission in the K band in IRS 54 from the SINFONI 2014 data. Four spectral channels were averaged from 2.12087 μm (−125 km s−1) to 2.12160 μm (−22 km s−1). Panel b: redshifted component of the H2 emission in the K band in IRS 54 from the SINFONI 2014 data. Four spectral channels were averaged from 2.12185 μm (30 km s−1) to 2.12258 μm (134 km s−1). For reference, the centre blue contours represent the position of the continuum of the source taken at levels of 0.2, 0.4, 0.6 and 0.8 of the continuum flux.
Current usage metrics show cumulative count of Article Views (full-text article views including HTML views, PDF and ePub downloads, according to the available data) and Abstracts Views on Vision4Press platform.
Data correspond to usage on the plateform after 2015. The current usage metrics is available 48-96 hours after online publication and is updated daily on week days.
Initial download of the metrics may take a while.