Fig. B.1.
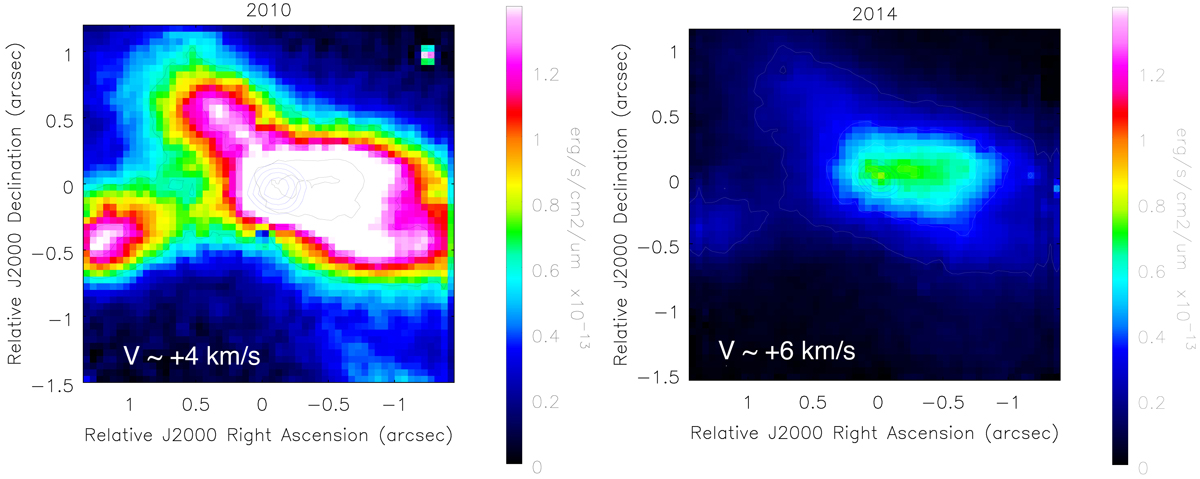
Continuum-subtracted SINFONI data from the 2010 (left panel) and 2014 (right panel) epochs taken by summing five spectral channels centred on the H2 emission line at 2.122 μm in the K band. The blue contours represent the spatial position of the continuum of the source taken at levels of 0.2, 0.4, 0.6, and 0.8 of the continuum flux.
Current usage metrics show cumulative count of Article Views (full-text article views including HTML views, PDF and ePub downloads, according to the available data) and Abstracts Views on Vision4Press platform.
Data correspond to usage on the plateform after 2015. The current usage metrics is available 48-96 hours after online publication and is updated daily on week days.
Initial download of the metrics may take a while.