Free Access
Fig. A.2.
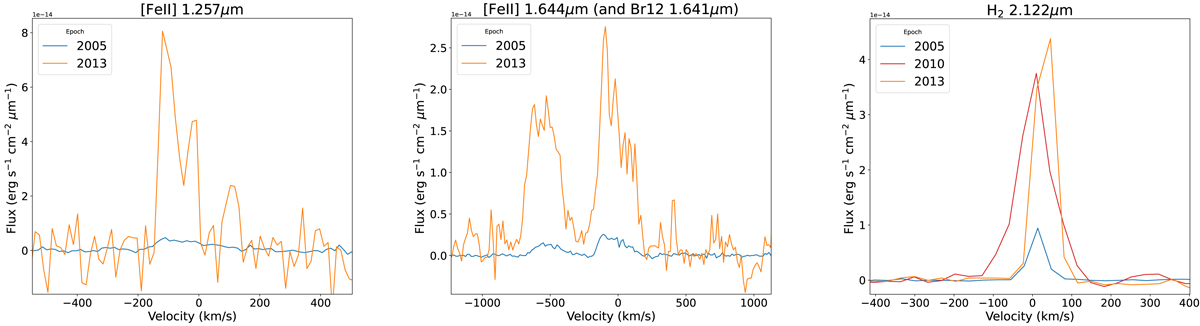
De-reddened flux of the outflow-tracing ([Fe II] and H2) lines from IRS 54. These plots were generated using the extinction values found in Table 3 for the 2005 and 2013 epochs. The 2010 epoch uses the extinction value found in GL13.
Current usage metrics show cumulative count of Article Views (full-text article views including HTML views, PDF and ePub downloads, according to the available data) and Abstracts Views on Vision4Press platform.
Data correspond to usage on the plateform after 2015. The current usage metrics is available 48-96 hours after online publication and is updated daily on week days.
Initial download of the metrics may take a while.