Open Access
Fig. 6.
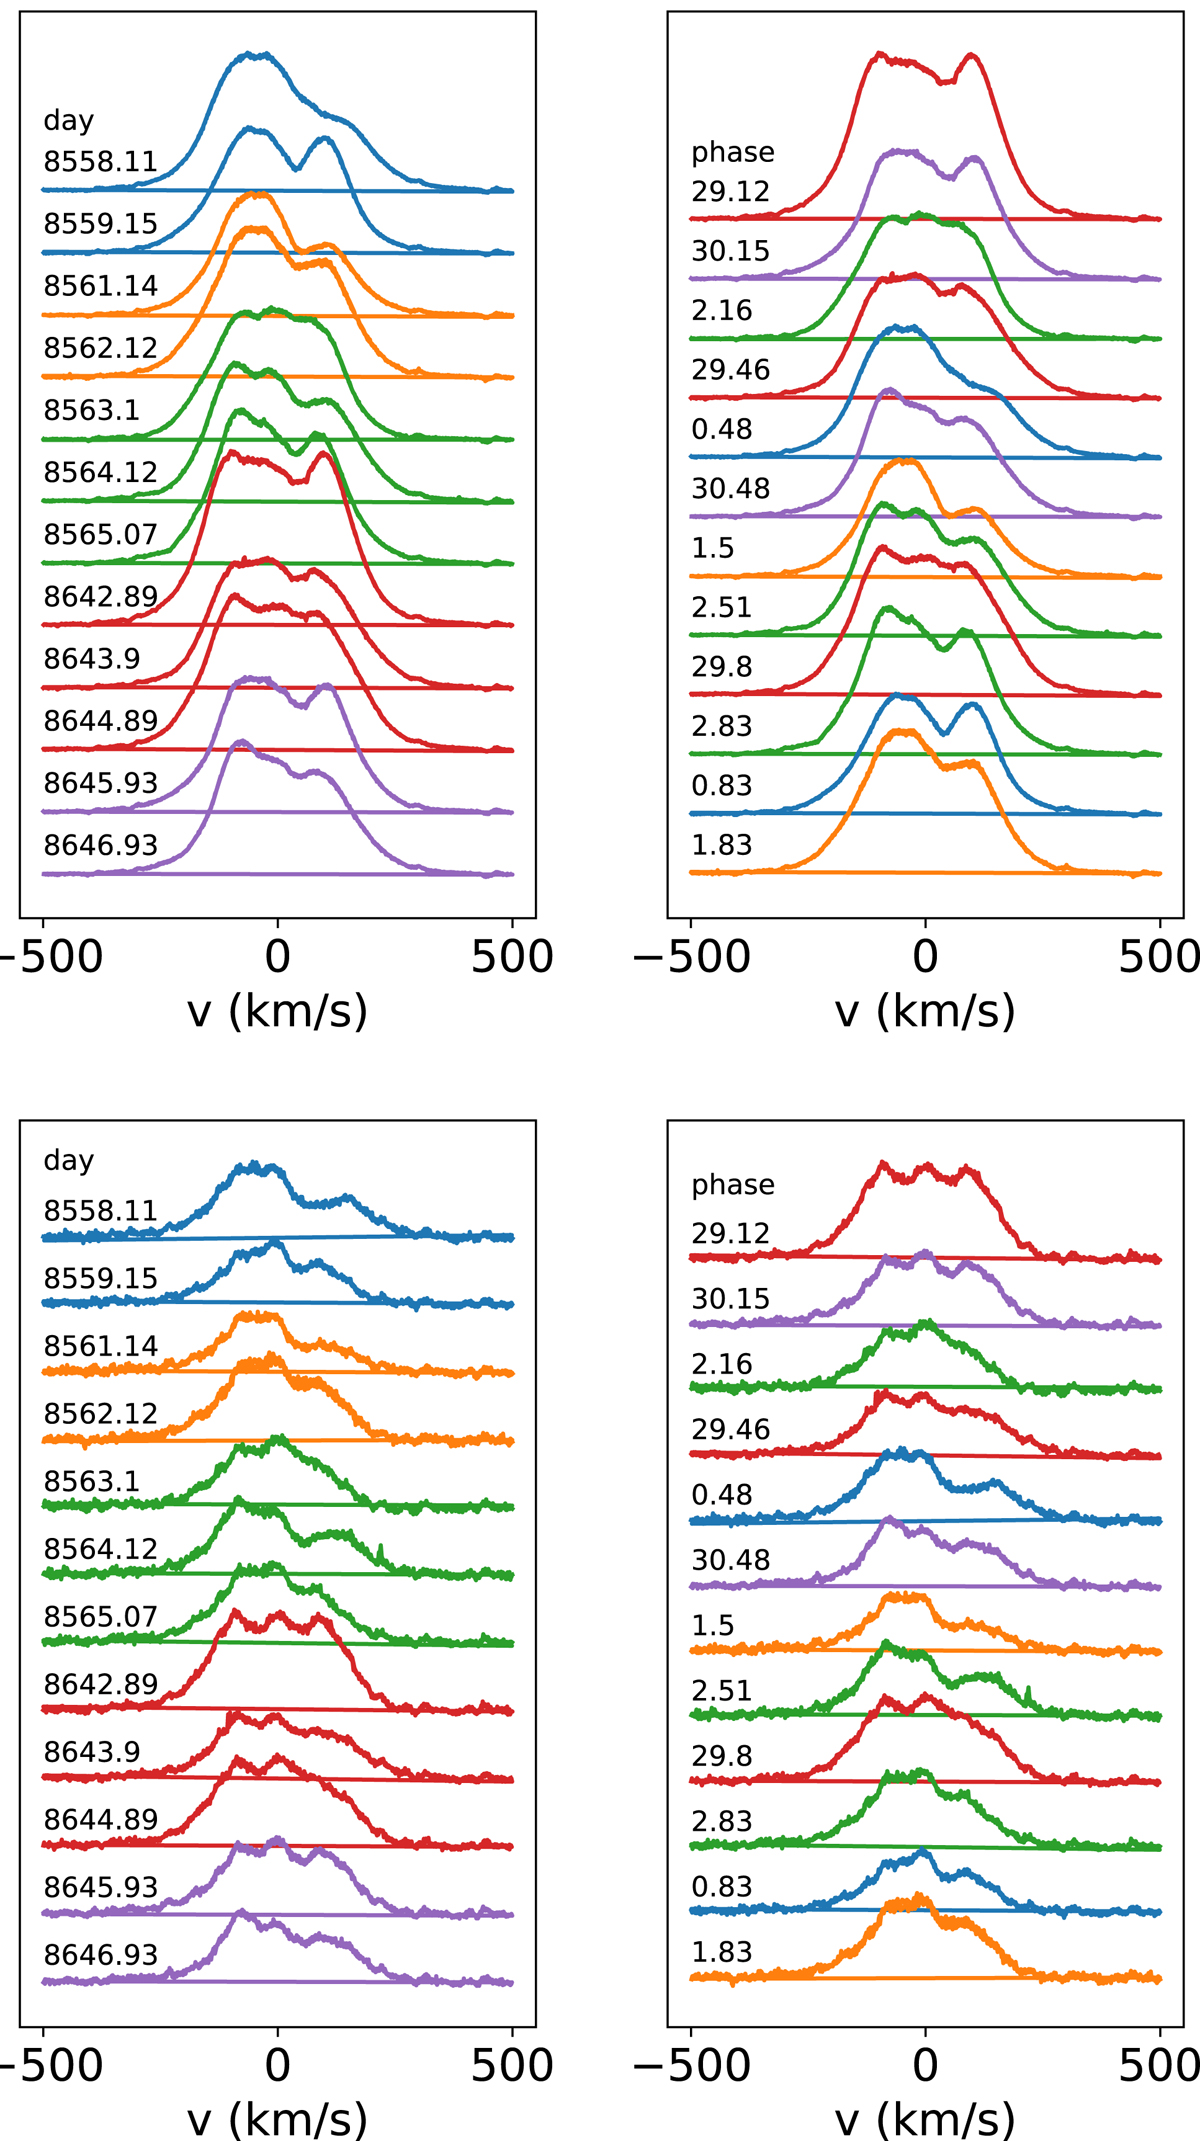
Hα (top) and Hβ (bottom) residual line profile variability as a function of date and phase. The color code corresponds to different rotational cycles. We note that both profiles appear less asymmetric in June than in March 2019, with a more depressed red wing at the earlier epoch.
Current usage metrics show cumulative count of Article Views (full-text article views including HTML views, PDF and ePub downloads, according to the available data) and Abstracts Views on Vision4Press platform.
Data correspond to usage on the plateform after 2015. The current usage metrics is available 48-96 hours after online publication and is updated daily on week days.
Initial download of the metrics may take a while.