Open Access
Fig. 4.
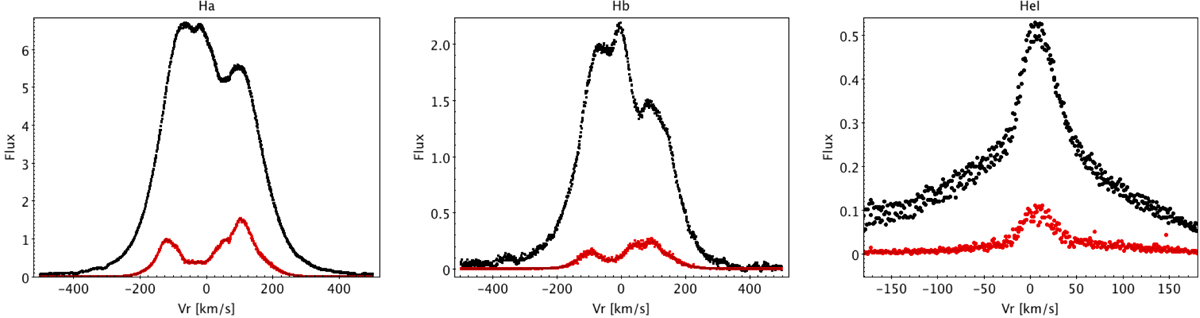
From left to right: mean (black) and variance (red) residual profiles for Hα, Hβ, and HeI 587.6 nm. Hα and Hβ appear on overlapping spectral orders, which are both shown here. For HeI, the variance has been multiplied by 10. The increased scatter over the blue wing of the HeI line profile is due to spectral order overlap.
Current usage metrics show cumulative count of Article Views (full-text article views including HTML views, PDF and ePub downloads, according to the available data) and Abstracts Views on Vision4Press platform.
Data correspond to usage on the plateform after 2015. The current usage metrics is available 48-96 hours after online publication and is updated daily on week days.
Initial download of the metrics may take a while.