Open Access
Fig. A.1.
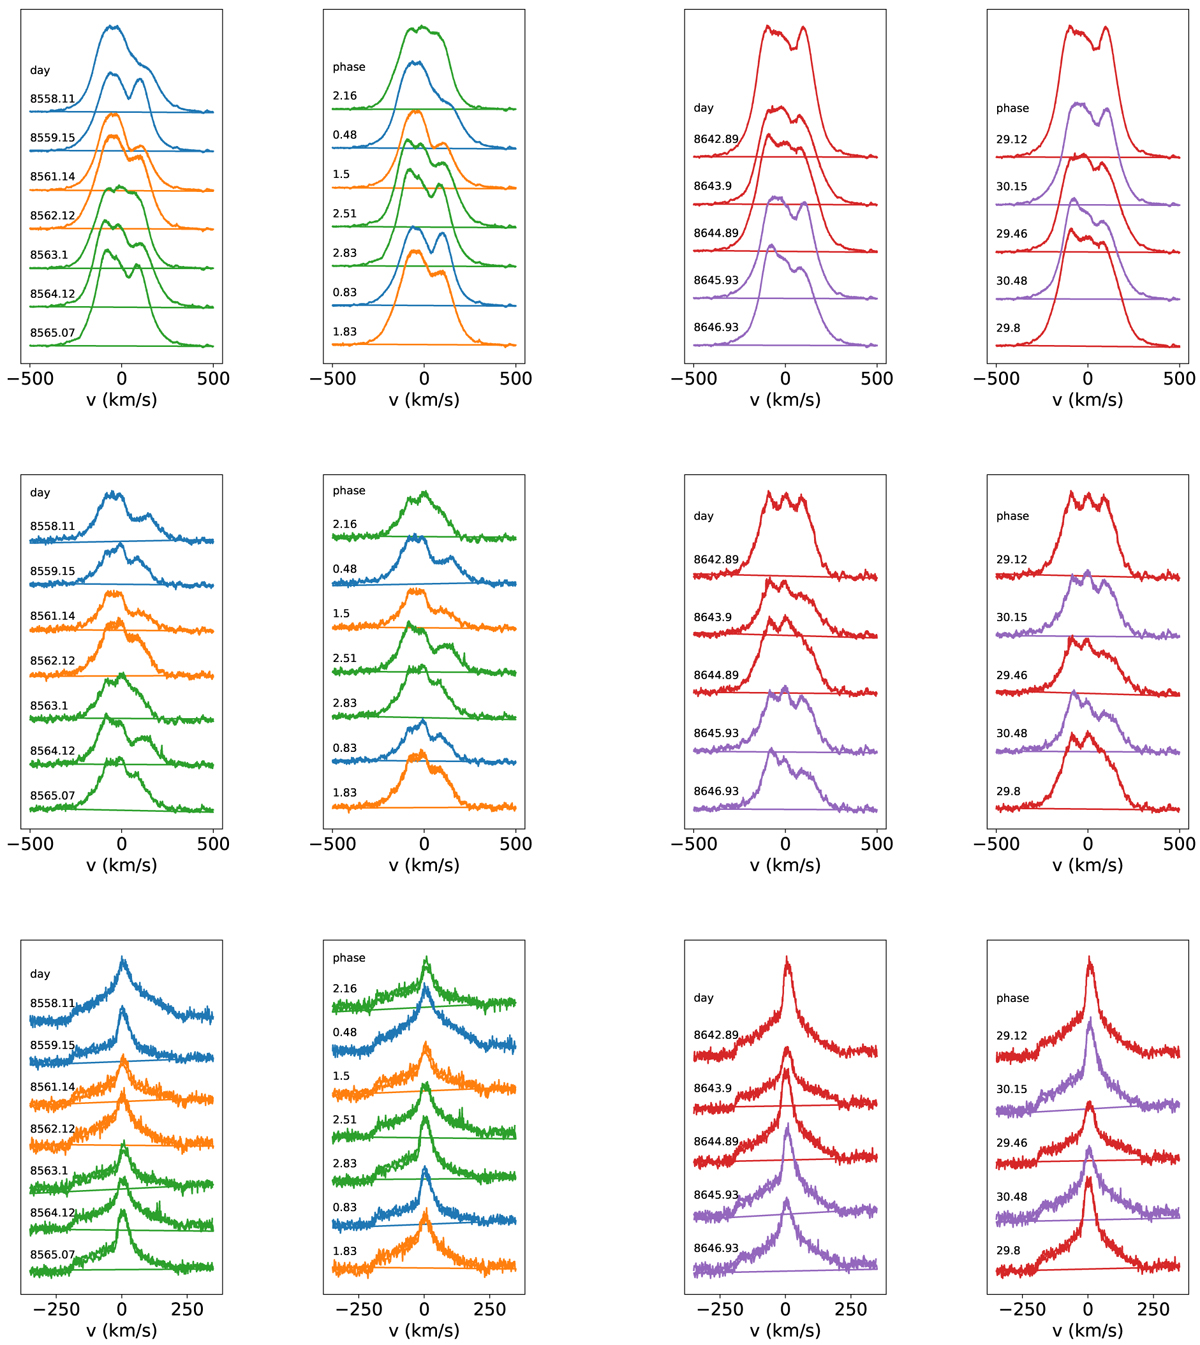
Hα, Hβ, and HeI line profiles from the seven spectra obtained during the ESPaDOnS March run (left panels) and the five spectra obtained during the June run (right panels). In each panel, the profiles are plotted in order of increasing date (left) and phase (right). Each color corresponds to a specific rotational cycle.
Current usage metrics show cumulative count of Article Views (full-text article views including HTML views, PDF and ePub downloads, according to the available data) and Abstracts Views on Vision4Press platform.
Data correspond to usage on the plateform after 2015. The current usage metrics is available 48-96 hours after online publication and is updated daily on week days.
Initial download of the metrics may take a while.