Fig. 18.
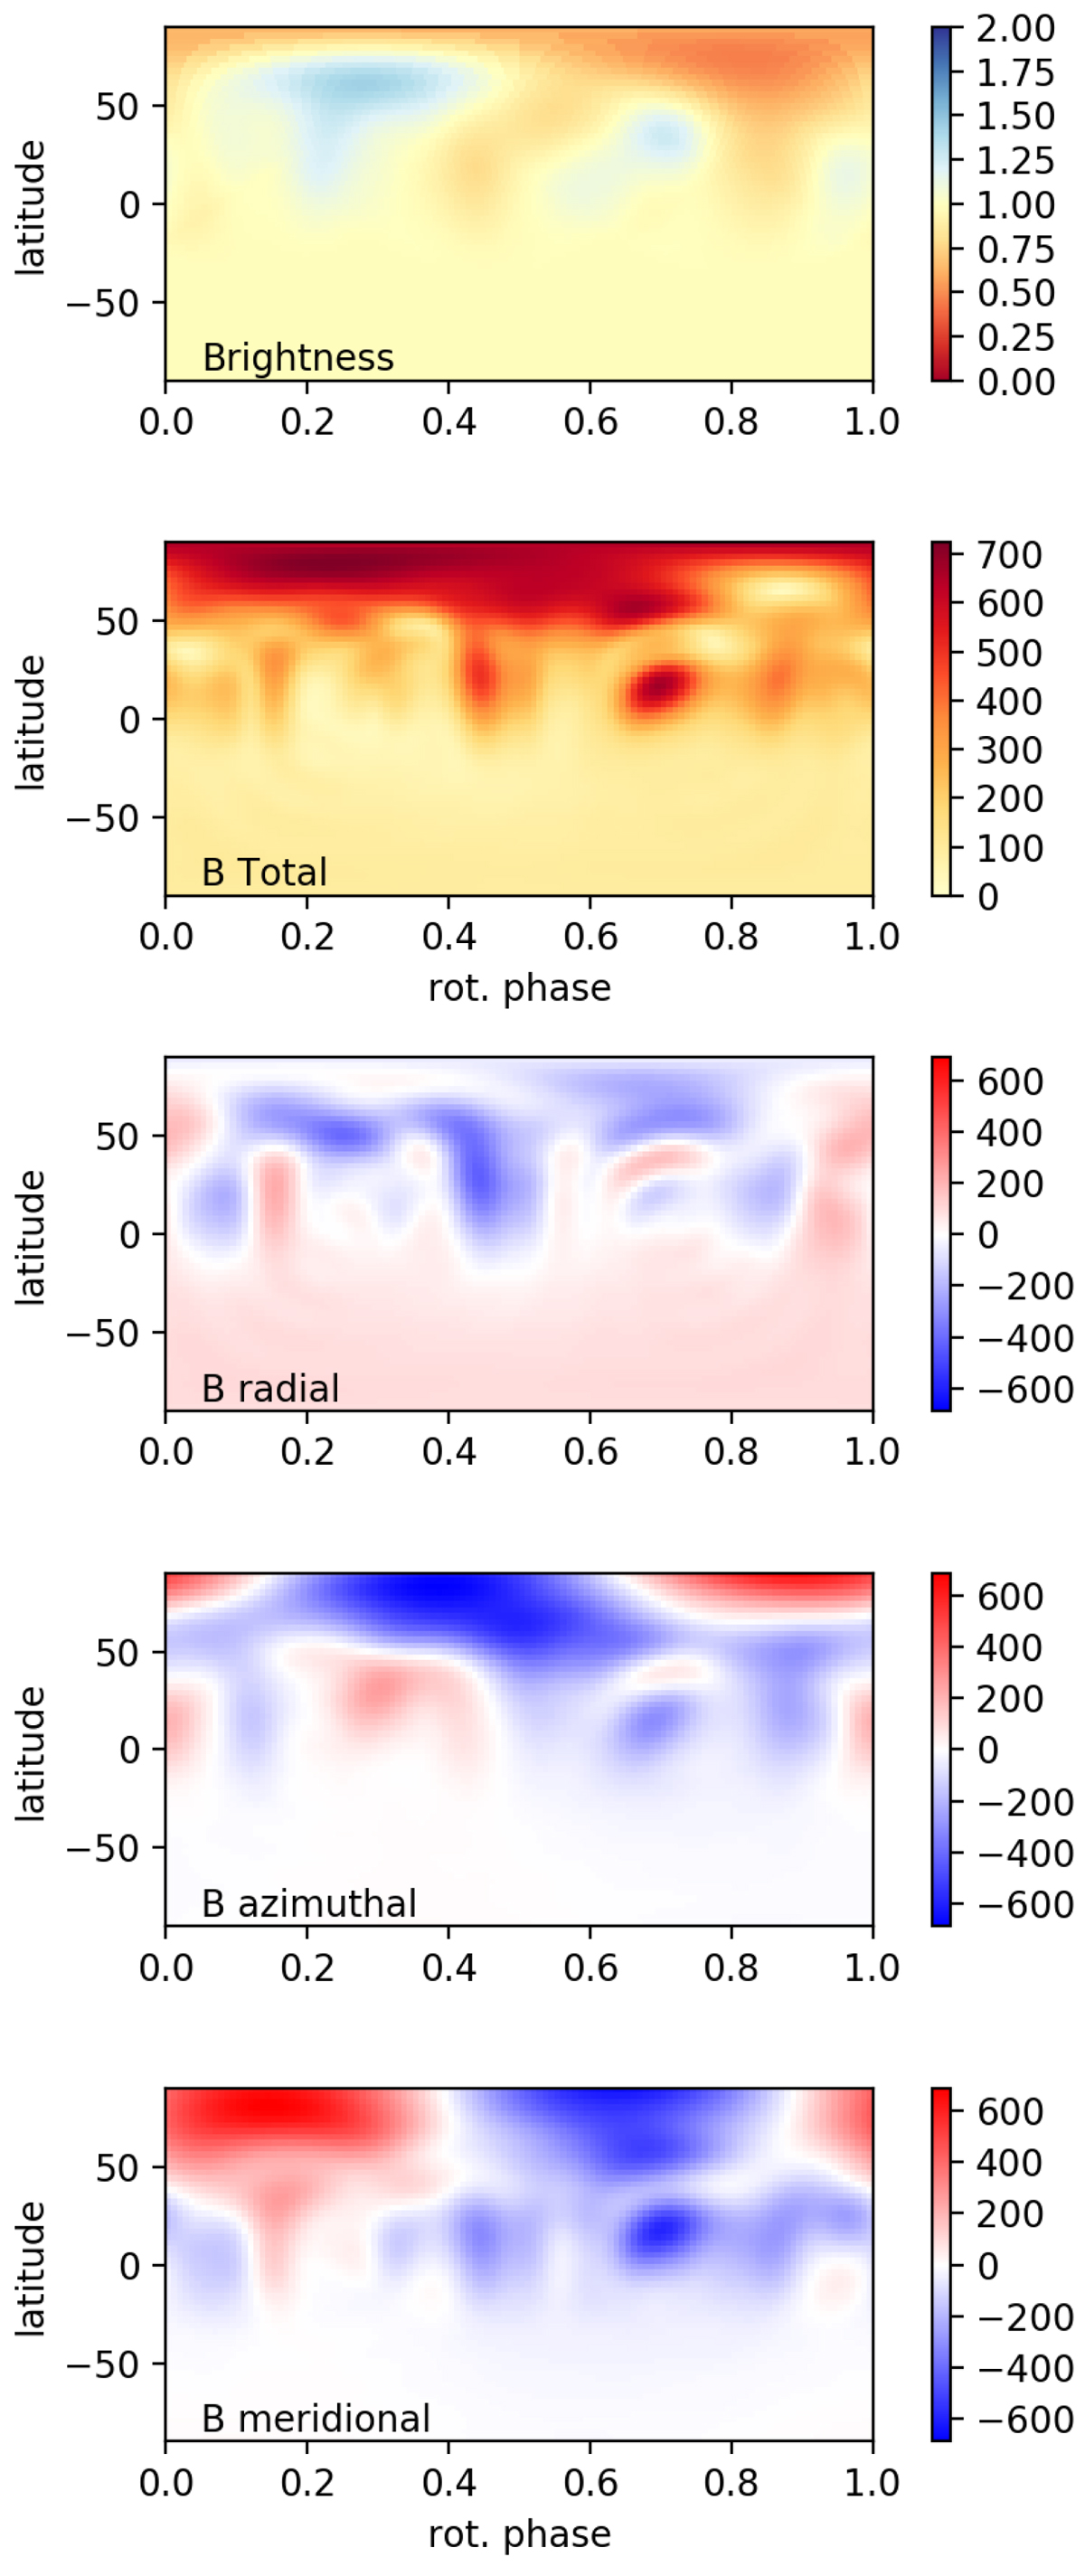
Top: brightness map derived from the variation of the LSD Stokes I profiles. The color code is 1 for the photospheric temperature, increases for hot spots, and decreases for cold ones. Bottom: the large-scale total, radial, longitudinal, and latitudinal surface magnetic field components, as derived from the variations of the LSD Stokes V profiles. The color code indicates the strength of the surface magnetic field in Gauss.
Current usage metrics show cumulative count of Article Views (full-text article views including HTML views, PDF and ePub downloads, according to the available data) and Abstracts Views on Vision4Press platform.
Data correspond to usage on the plateform after 2015. The current usage metrics is available 48-96 hours after online publication and is updated daily on week days.
Initial download of the metrics may take a while.