Fig. 17.
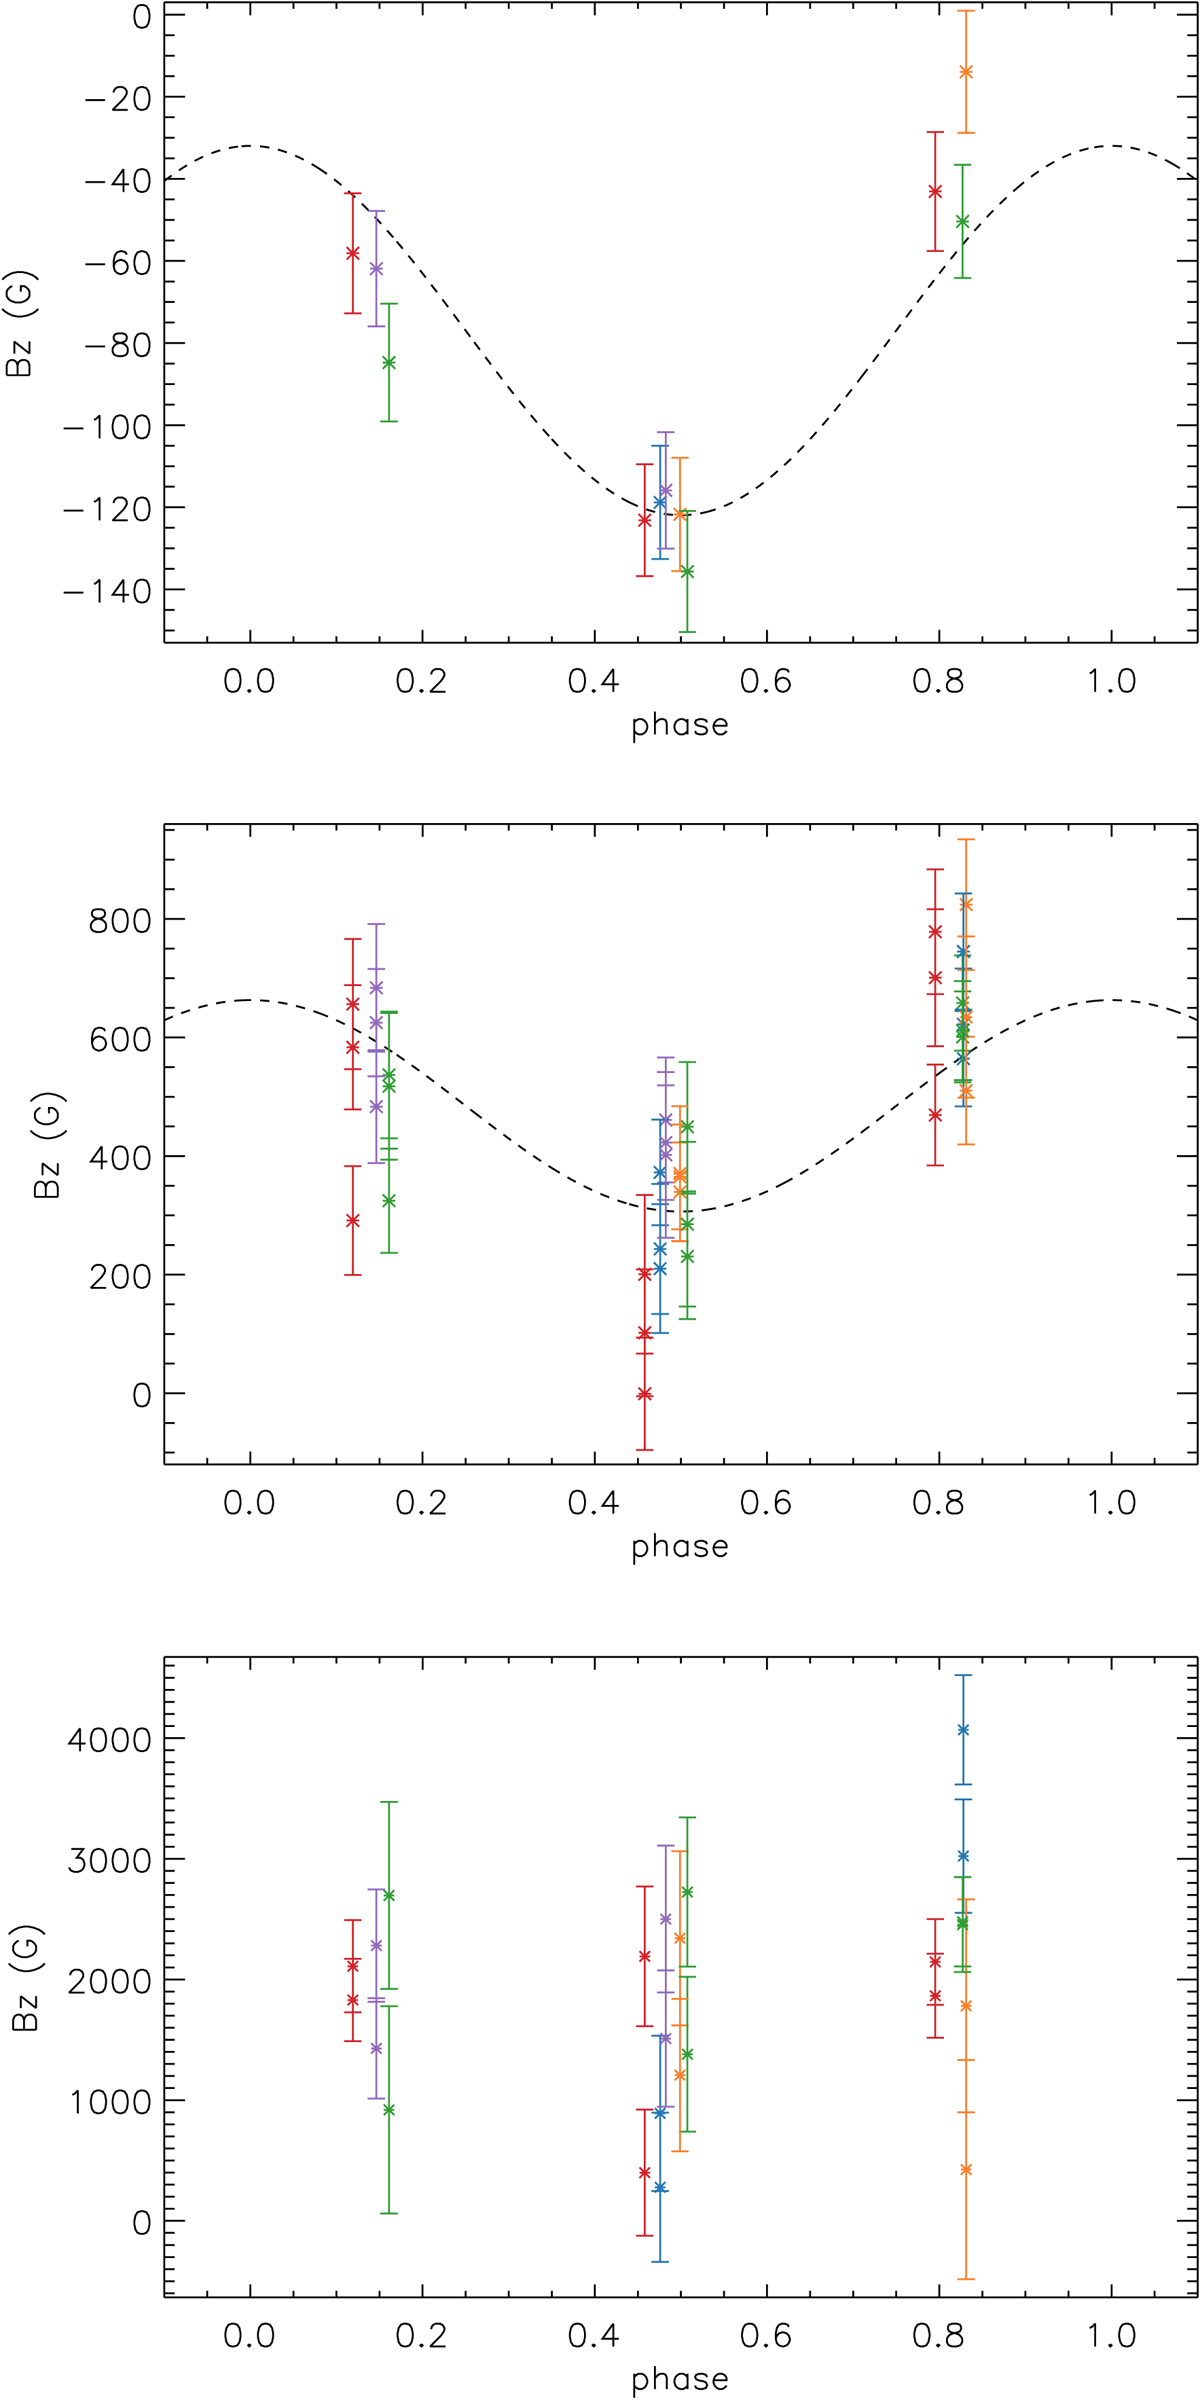
Rotational modulation of the longitudinal component of the large-scale magnetic field, derived from the LSD profiles (top), from the CaII IR triplet (middle), and from the narrow component of the HeI 587.6 nm lines profile (bottom). The color code corresponds to successive rotational cycles. We emphasize the phase consistency between the March and June datasets, as well as the apparently constant amplitude of the field between the two epochs. In the top panel, the sine curve has been fit with the period and origin of phase of the photometric ephemeris. It shows that the maximum intensity of the photospheric field occurs at phase 0.5, that is, at the time of minimum brightness (see Fig. 3). In the middle panel, the three measurements at each phase are obtained for each line of the CaII IR triplet. In the lower panel, there are two measurements per spectrum, as the HeI line appears on successive spectral orders. The three plots are not on the same scale.
Current usage metrics show cumulative count of Article Views (full-text article views including HTML views, PDF and ePub downloads, according to the available data) and Abstracts Views on Vision4Press platform.
Data correspond to usage on the plateform after 2015. The current usage metrics is available 48-96 hours after online publication and is updated daily on week days.
Initial download of the metrics may take a while.