Fig. 1.
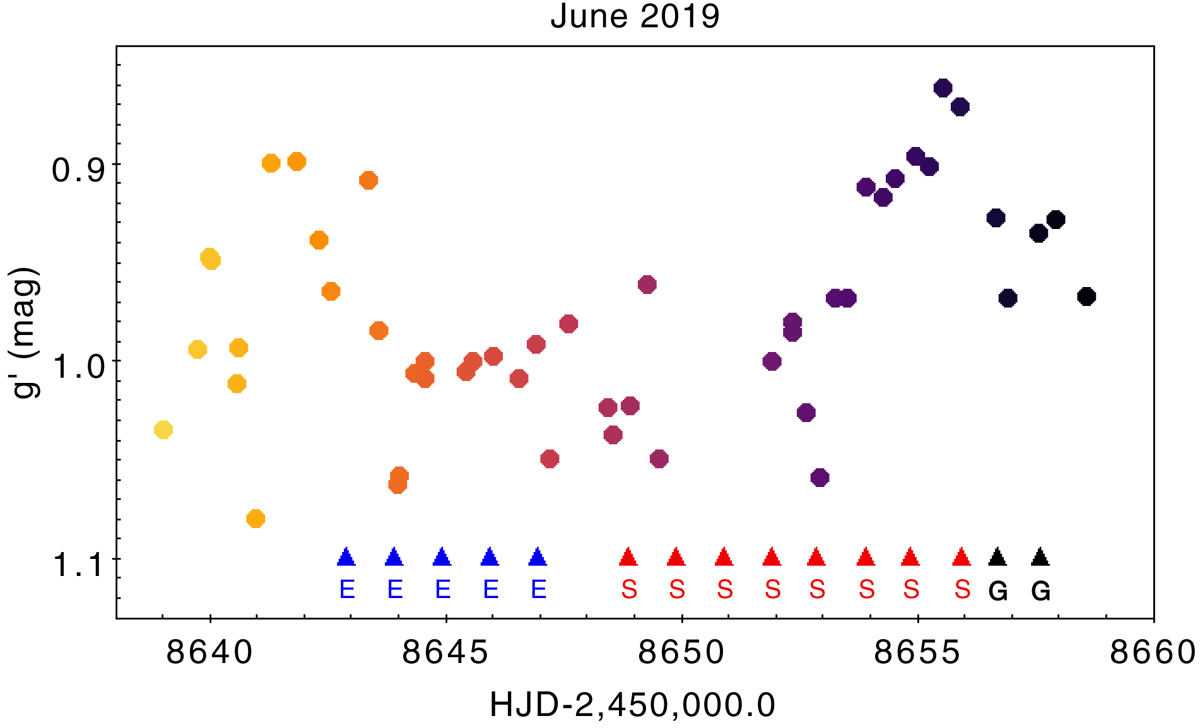
Visual summary of observations obtained in June 2019, as part of the DoAr 44 coordinated campaign. The differential g′-band light curve (see Sect. 3.2) is shown as colored circles, with the color scale reflecting the Julian Date, while the epochs of CFHT/ESPaDOnS, CFHT/SPIRou, and ESO VLTI/Gravity observations are indicated by triangles labeled with “E”, “S”, and “G”, respectively. Note that the March 2019 ESPaDOnS run, which is part of the campaign reported here, is not shown in this figure. The average g-band magnitude of the system during the campaign was g = 13.35 according to the publicly available Zwicky Transient Facility light curve (Masci et al. 2019).
Current usage metrics show cumulative count of Article Views (full-text article views including HTML views, PDF and ePub downloads, according to the available data) and Abstracts Views on Vision4Press platform.
Data correspond to usage on the plateform after 2015. The current usage metrics is available 48-96 hours after online publication and is updated daily on week days.
Initial download of the metrics may take a while.