Free Access
Fig. 8.
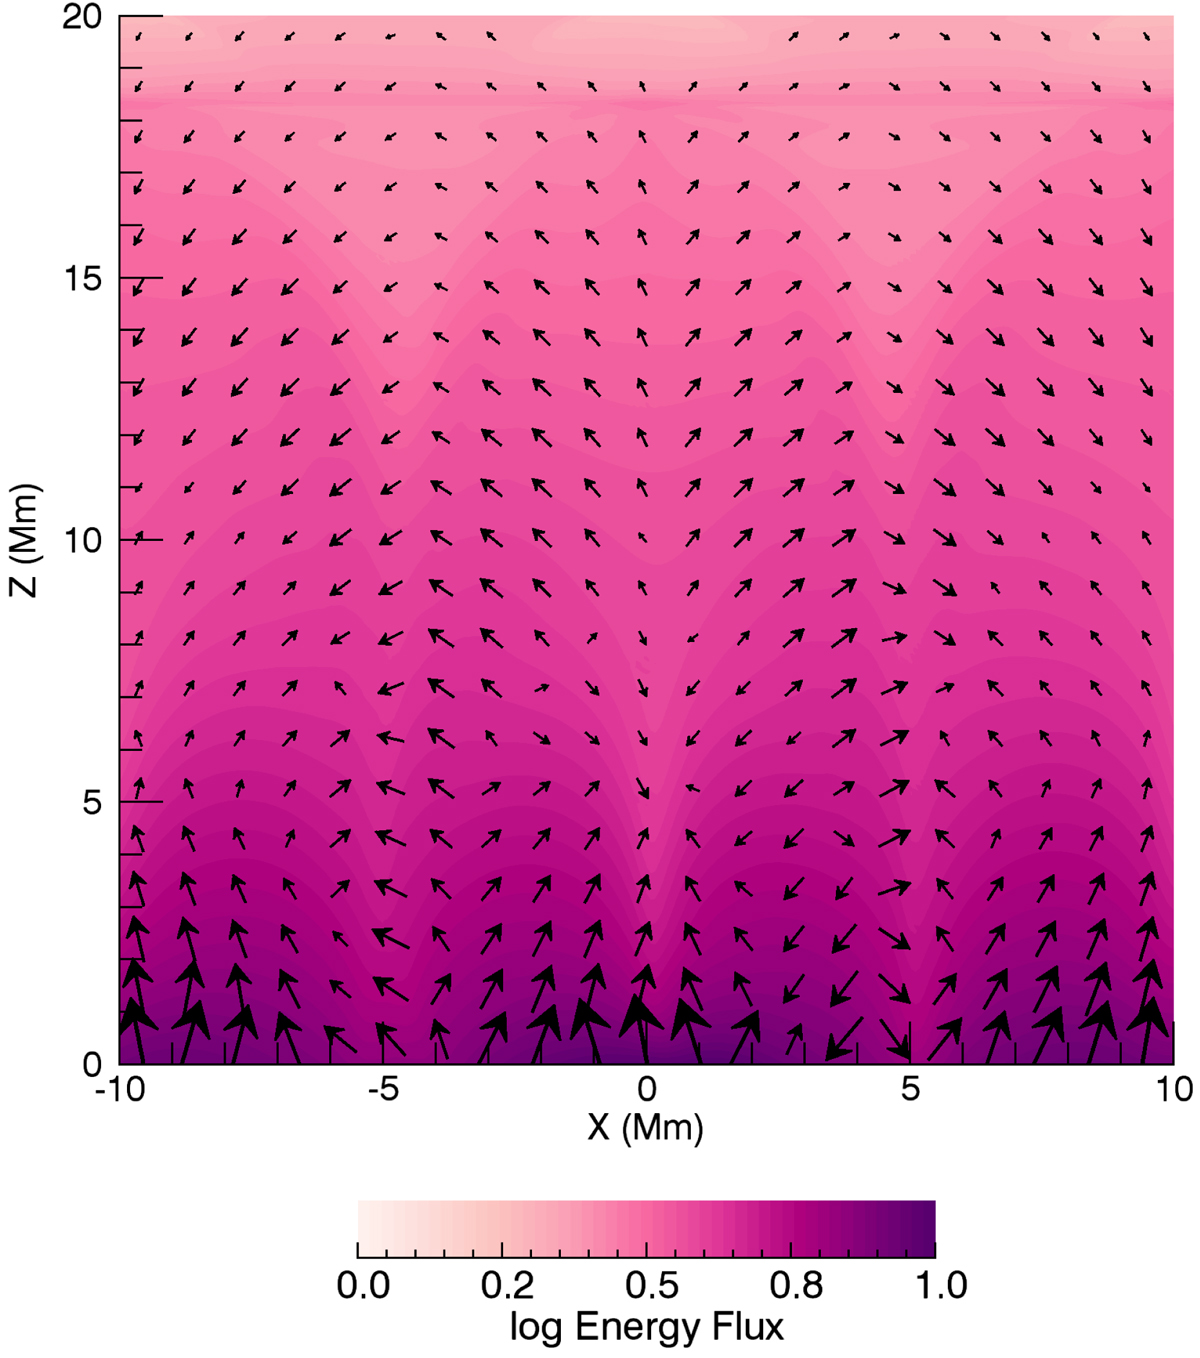
Vectors: energy flux averaged over the length of the arcade and the duration of the ideal T2 simulation. Contours: magnitude of the energy flux. For clarity, we show the logarithm of this quantity.
Current usage metrics show cumulative count of Article Views (full-text article views including HTML views, PDF and ePub downloads, according to the available data) and Abstracts Views on Vision4Press platform.
Data correspond to usage on the plateform after 2015. The current usage metrics is available 48-96 hours after online publication and is updated daily on week days.
Initial download of the metrics may take a while.