Free Access
Fig. 7.
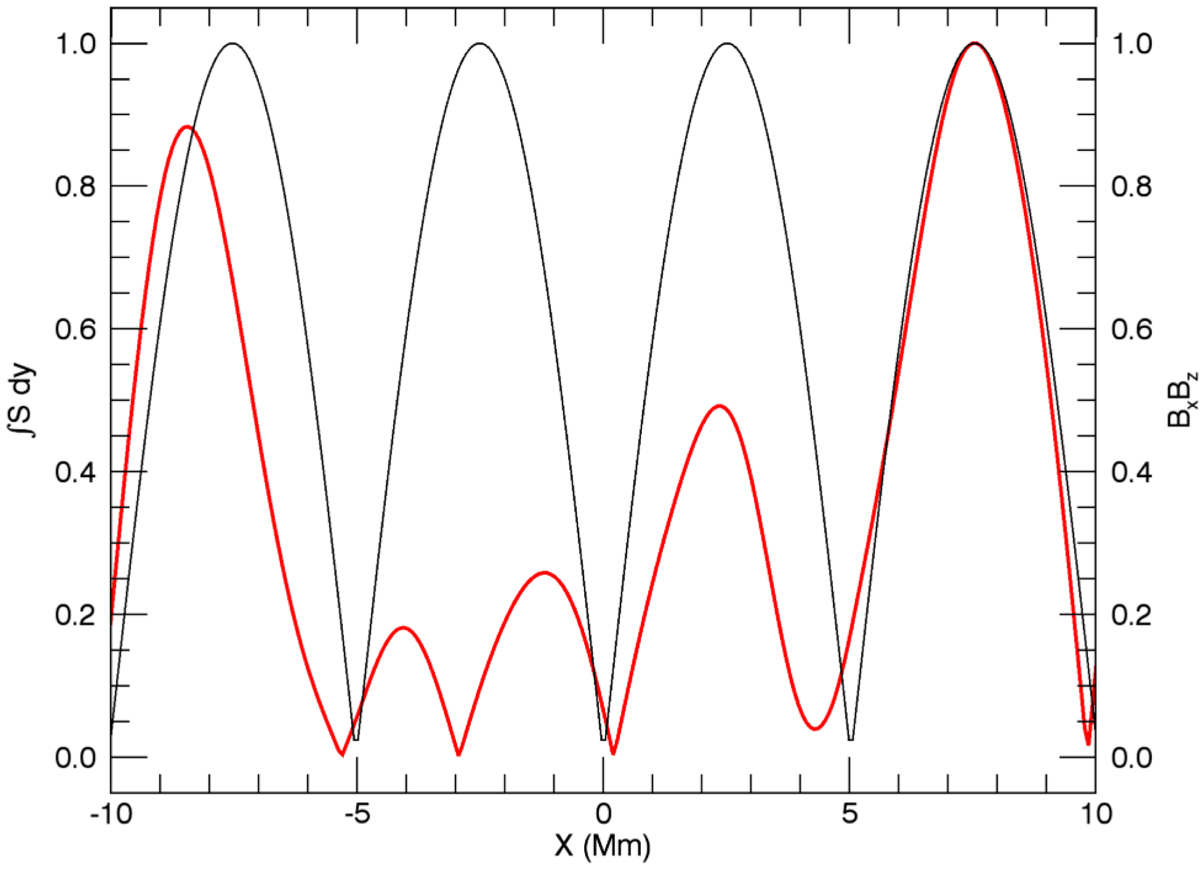
Red line: magnitude of the time-averaged Poynting flux through the driven boundary as a function of x for the ideal T2 simulation. Black line: initial value of BxBz(x). For both lines, we have normalised by the maximum values.
Current usage metrics show cumulative count of Article Views (full-text article views including HTML views, PDF and ePub downloads, according to the available data) and Abstracts Views on Vision4Press platform.
Data correspond to usage on the plateform after 2015. The current usage metrics is available 48-96 hours after online publication and is updated daily on week days.
Initial download of the metrics may take a while.