Fig. 12.
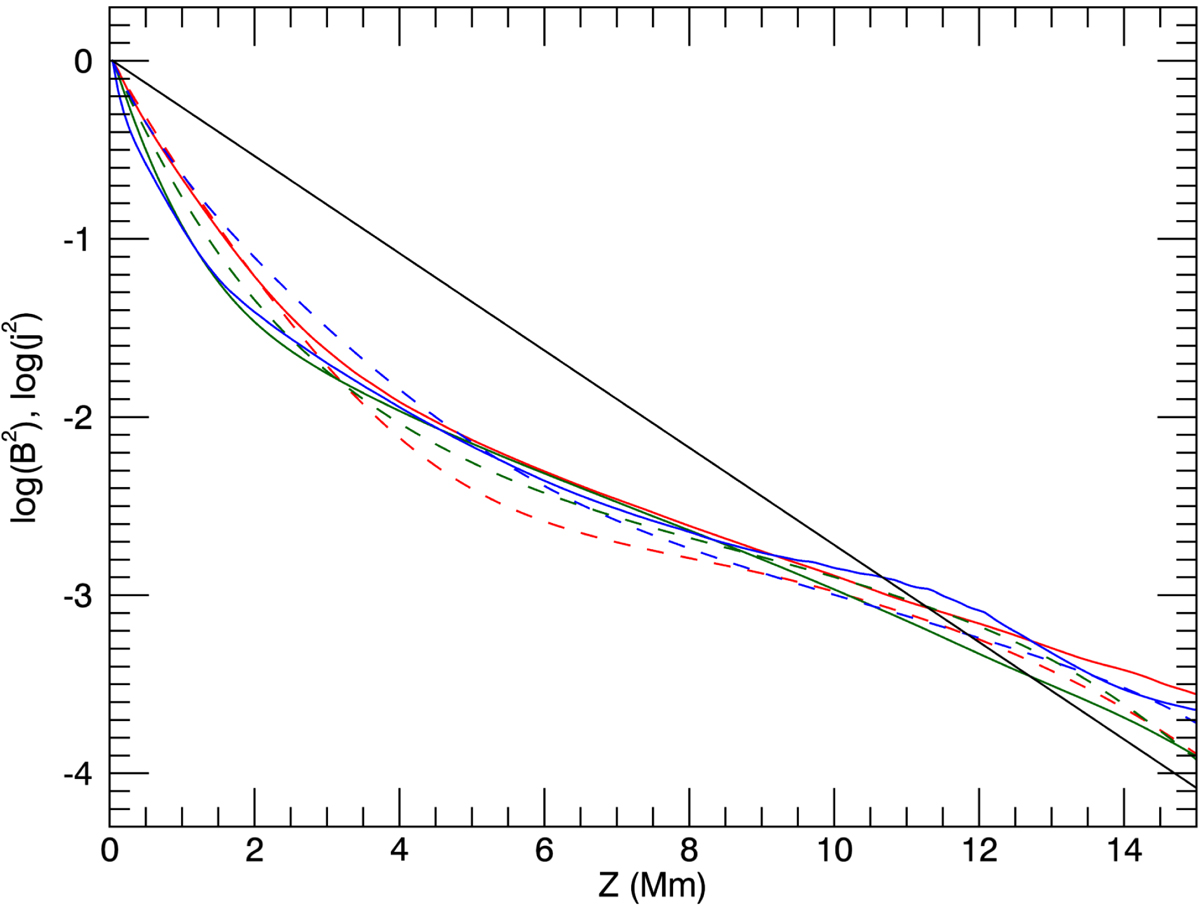
Mean of j2 as a function of height at the end of the T1 (solid red), T2 (solid green) and T3 (solid blue) simulations. We also show the mean of the perturbed magnetic field strength for the T1 (dashed red), T2 (dashed green) and T3 (dashed blue) simulations. The solid black line shows the mean of the initial magnetic field strength as a function of height. For all variables we have normalised by their respective maxima and taken logarithms.
Current usage metrics show cumulative count of Article Views (full-text article views including HTML views, PDF and ePub downloads, according to the available data) and Abstracts Views on Vision4Press platform.
Data correspond to usage on the plateform after 2015. The current usage metrics is available 48-96 hours after online publication and is updated daily on week days.
Initial download of the metrics may take a while.