Fig. 11.
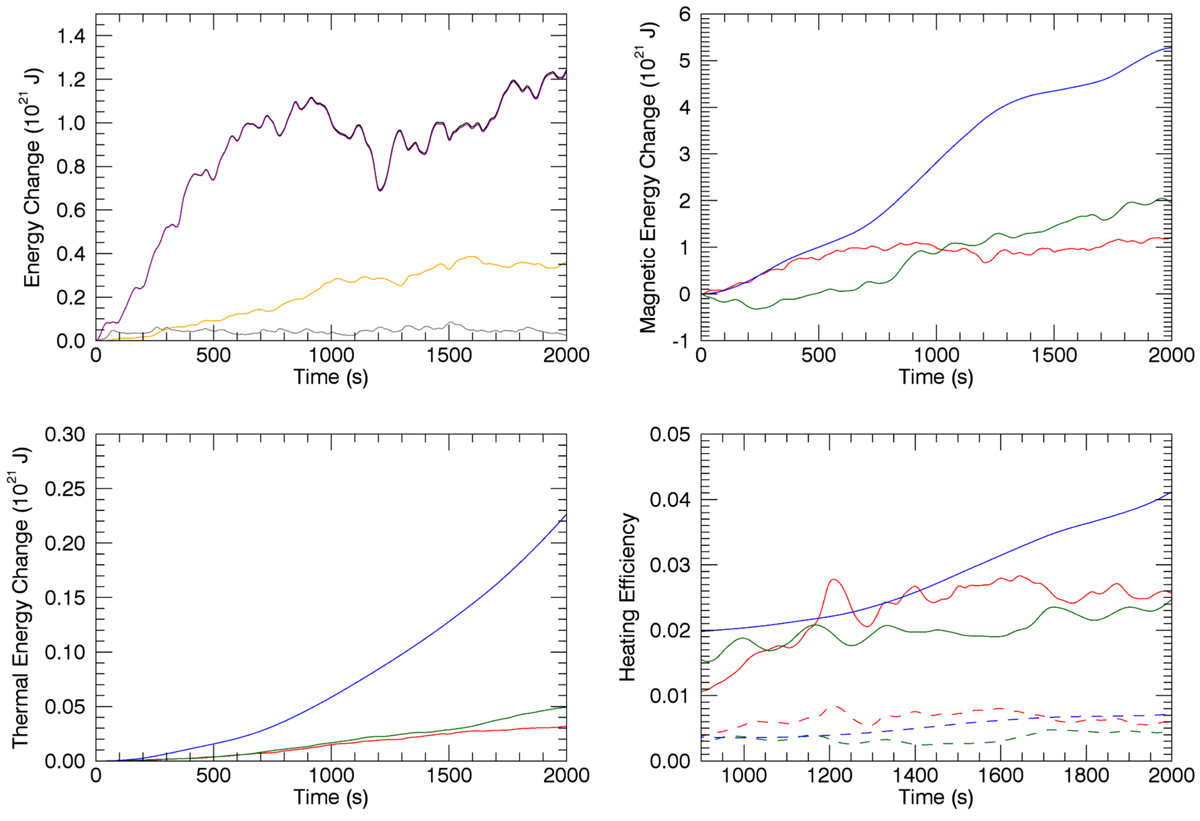
Upper left: energy increase in the T1, ideal simulation. We show each component of the energy: magnetic (purple), thermal (orange), and kinetic (grey). In order to make the last two lines visible, we have multiplied by factors of 50 and 500, respectively. The total energy change is shown in black and is almost identical to the purple line. Upper right: increase in volume integrated magnetic energy for resistive T1 (red), T2 (green), and T3 (blue) simulations. Lower left: increase in volume integrated thermal energy for resistive T1 (solid red), T2 (solid green), and T3 (solid blue) simulations. Lower right: heating efficiency for resistive T1 (red), T2 (green), and T3 (blue) simulations. This is calculated as the ratio between the increase in thermal energy and the total energy increase.
Current usage metrics show cumulative count of Article Views (full-text article views including HTML views, PDF and ePub downloads, according to the available data) and Abstracts Views on Vision4Press platform.
Data correspond to usage on the plateform after 2015. The current usage metrics is available 48-96 hours after online publication and is updated daily on week days.
Initial download of the metrics may take a while.