Fig. 10.
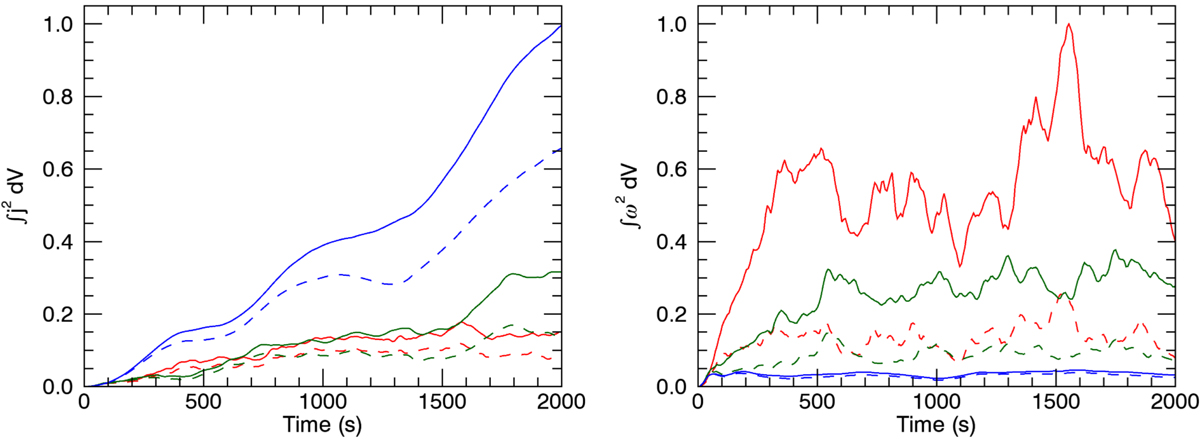
Left: volume integral of the square of the current density throughout the T1 (red), T2 (green), and T3 (blue) simulations. We show results for ideal (solid lines) and resistive (dashed) experiments. Right: volume integral of the square of the vorticity for the T1 (red), T2 (green), and T3 (blue) simulation. We show results for ideal (solid lines) and viscous (dashed) experiments. In each panel, we have normalised the curves using the maximum values obtained during the simulations.
Current usage metrics show cumulative count of Article Views (full-text article views including HTML views, PDF and ePub downloads, according to the available data) and Abstracts Views on Vision4Press platform.
Data correspond to usage on the plateform after 2015. The current usage metrics is available 48-96 hours after online publication and is updated daily on week days.
Initial download of the metrics may take a while.