Fig. 6
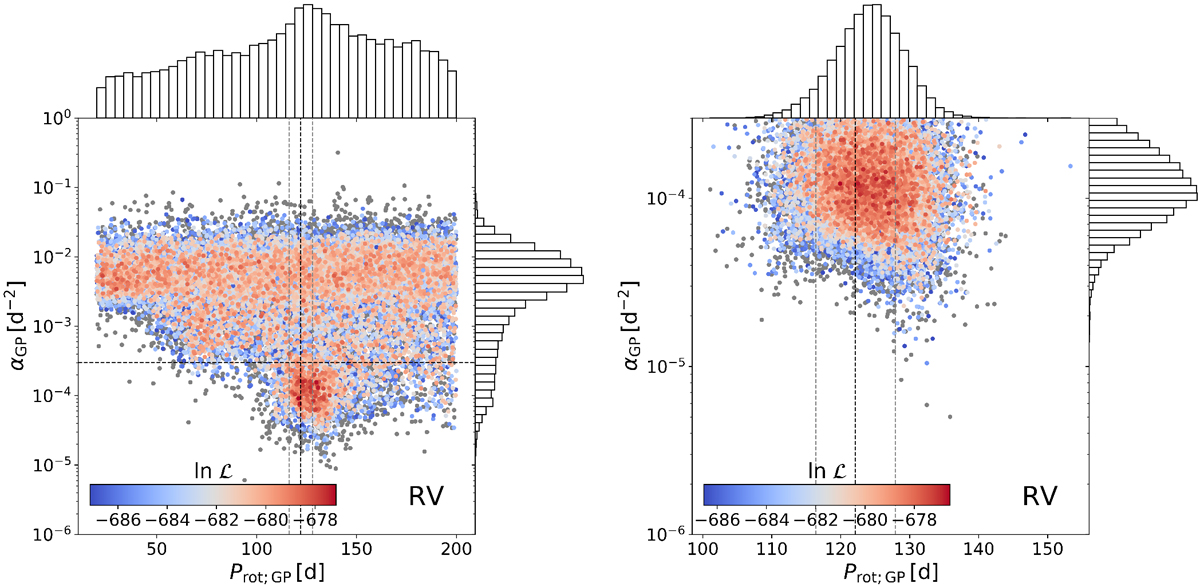
Posterior distribution of the GP fit to the RV data in the αGP vs. Prot plane for GJ 251. The color-coding shows the log-likelihood normalized to the highest value in the posterior sample. Gray samples indicate solutions with a Δ ln L > 10 compared to the best solution. Top: GP fit to the RV data with a wide uniform prior for the rotational period. Bottom: GP fit to the RV data with an informative normal prior based on the photometric GP results and additional constraints on the other hyperparameters. We overplot the derived rotational period of the photometric GP and its 3σ uncertainties with vertical lines. The horizontal line marks the cut in αGP used to constrain the GP fit shown in the lower plot.
Current usage metrics show cumulative count of Article Views (full-text article views including HTML views, PDF and ePub downloads, according to the available data) and Abstracts Views on Vision4Press platform.
Data correspond to usage on the plateform after 2015. The current usage metrics is available 48-96 hours after online publication and is updated daily on week days.
Initial download of the metrics may take a while.