Fig. 23
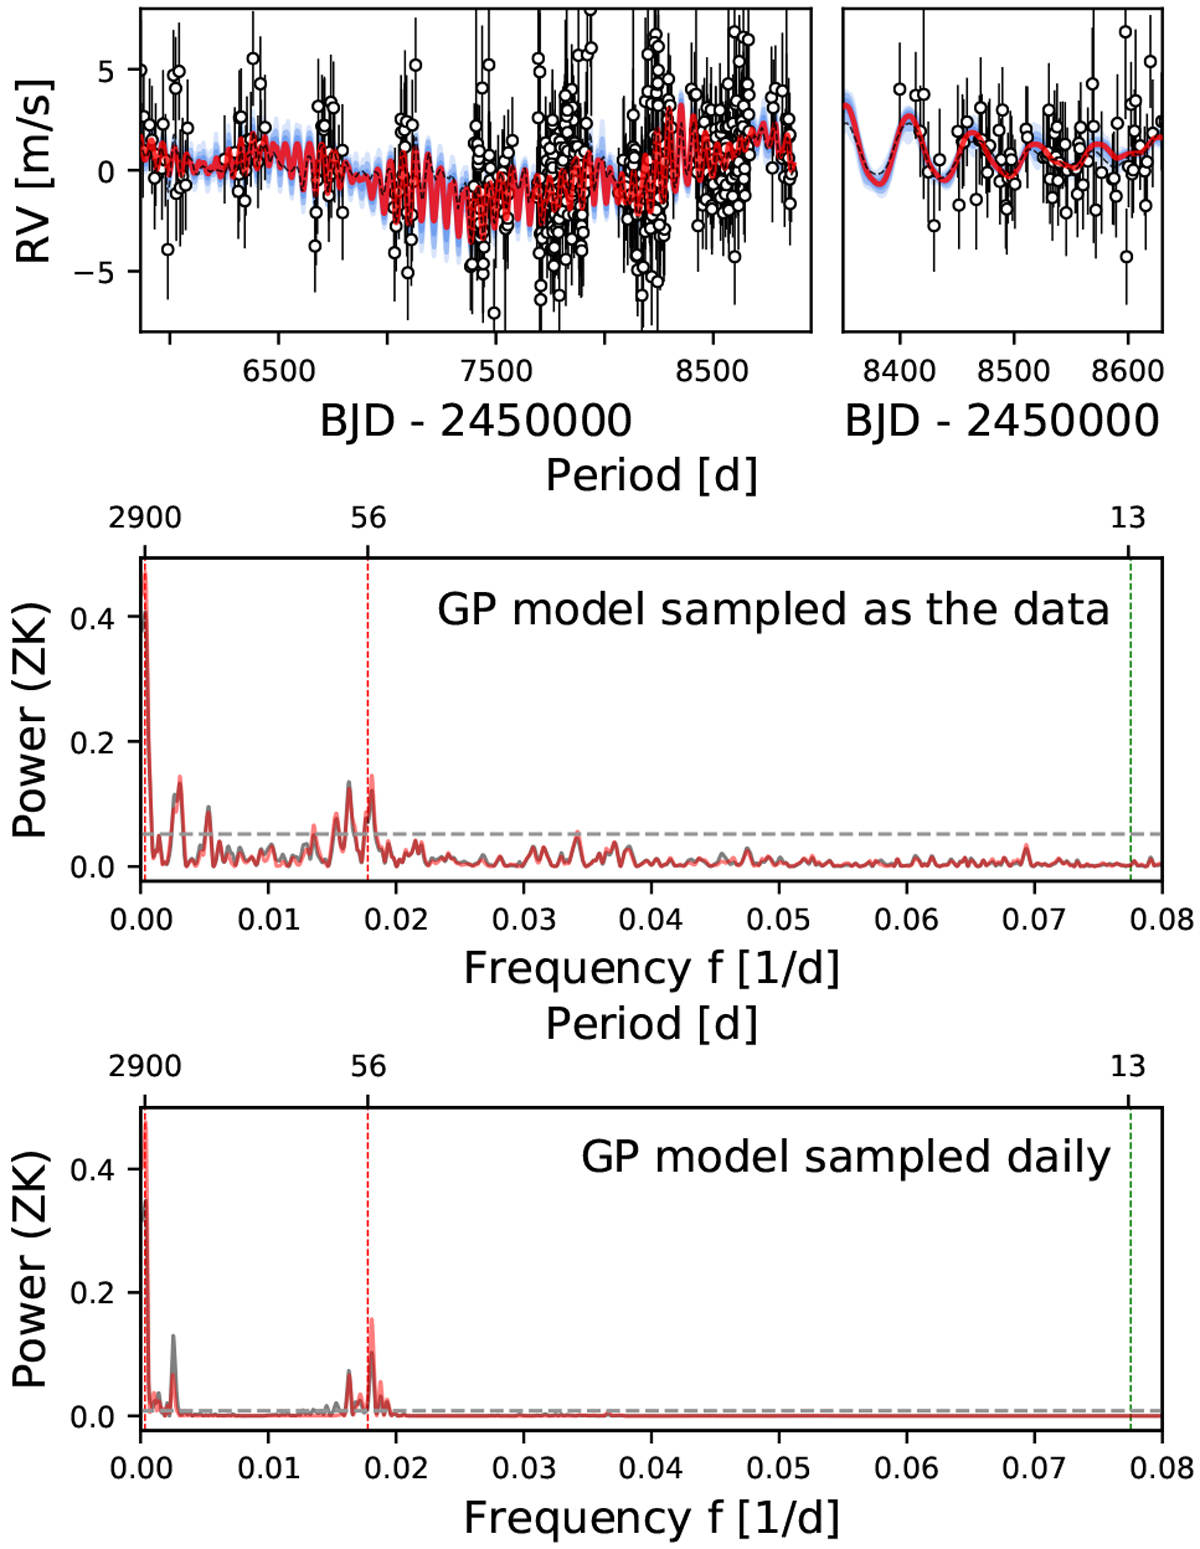
Gaussian process model for the RV data of Lalande 21185. The planetary signal is not included in the model and subtracted from the RV data. The constrained GP model is shown in red. The blue regions shows the 1σ, 2σ, and 3σ uncertainties. We show a zoom into some CARMENES observations (top right). The GLS is evaluated on the GP model at each observed data point (top GLS) and daily (bottom GLS). The dashed line in the GLS periodograms indicates an FAP of 10−3. We also show the unconstrained GP model as the dashed black line in the upper plots and as the gray periodograms in the lower plots.
Current usage metrics show cumulative count of Article Views (full-text article views including HTML views, PDF and ePub downloads, according to the available data) and Abstracts Views on Vision4Press platform.
Data correspond to usage on the plateform after 2015. The current usage metrics is available 48-96 hours after online publication and is updated daily on week days.
Initial download of the metrics may take a while.