Fig. 18
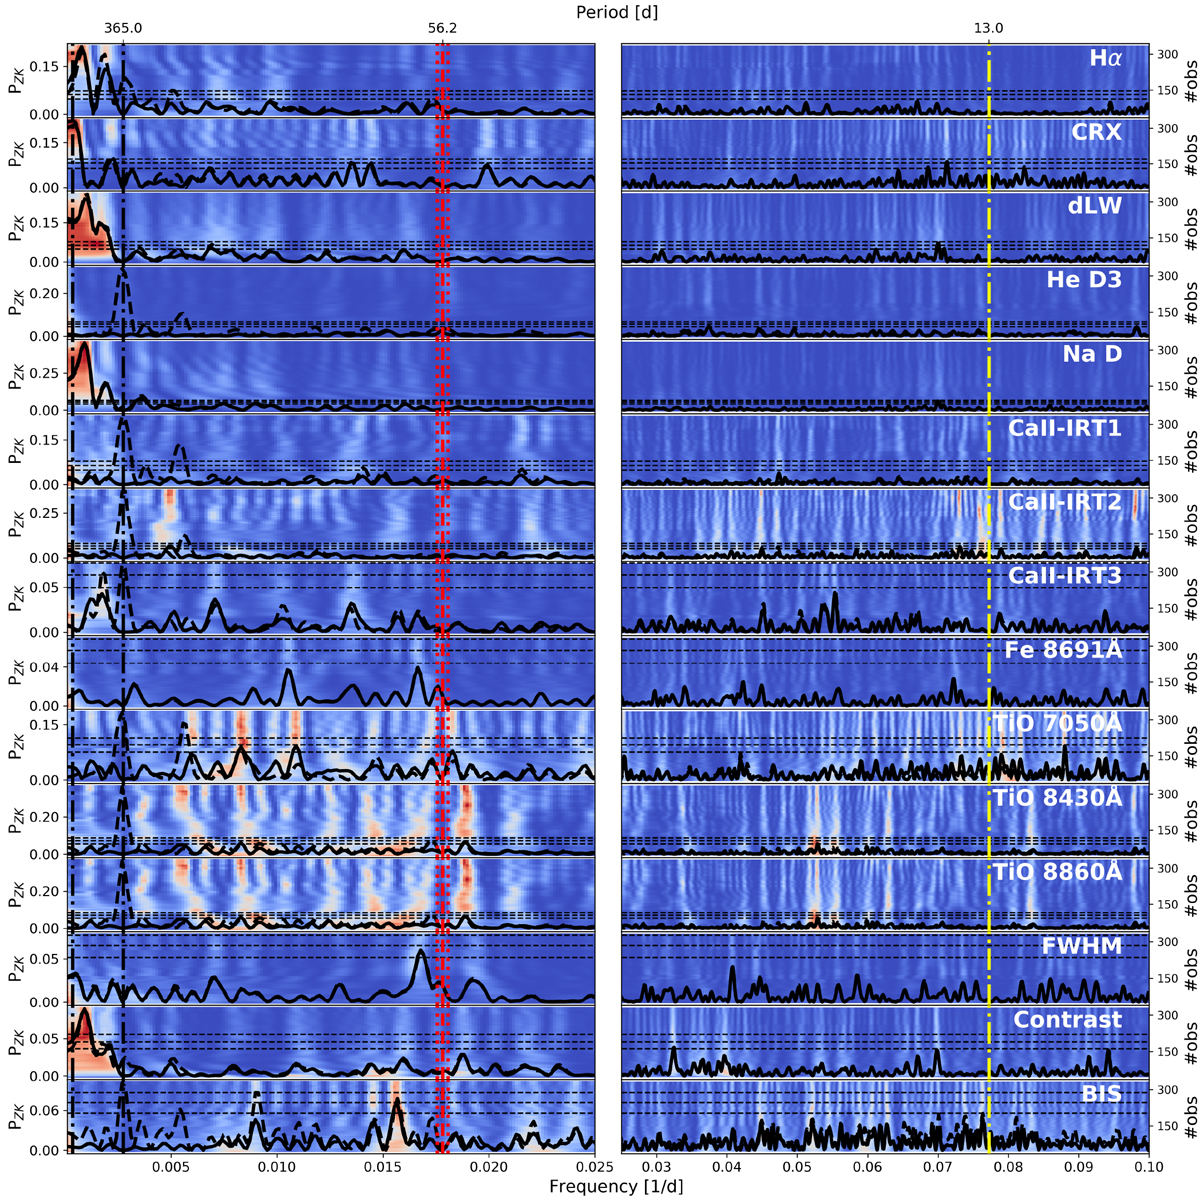
Generalized Lomb-Scargle periodograms of several activity indicators based on spectroscopic data obtained by CARMENES for Lalande 21185. The thinner dashed black periodograms represent the GLS on the activity indicators, and the solid GLS periodogram represents the residuals from which a 365 d sinusoidal signal was subtracted. For the residuals from which the 365 d signal was subtracted, we also overplot the s-BGLS periodogram, where the probability increases from blue to white to red. The dashed red lines mark the rotation period and the first harmonic estimated by photometric data, and the dotted red lines show the 3σ uncertainties. The dashed black lines mark a period of 365, 1400, and 2800 d, and the dashed yellow line marks the period of the planetary signal published in this work.
Current usage metrics show cumulative count of Article Views (full-text article views including HTML views, PDF and ePub downloads, according to the available data) and Abstracts Views on Vision4Press platform.
Data correspond to usage on the plateform after 2015. The current usage metrics is available 48-96 hours after online publication and is updated daily on week days.
Initial download of the metrics may take a while.