Fig. 7
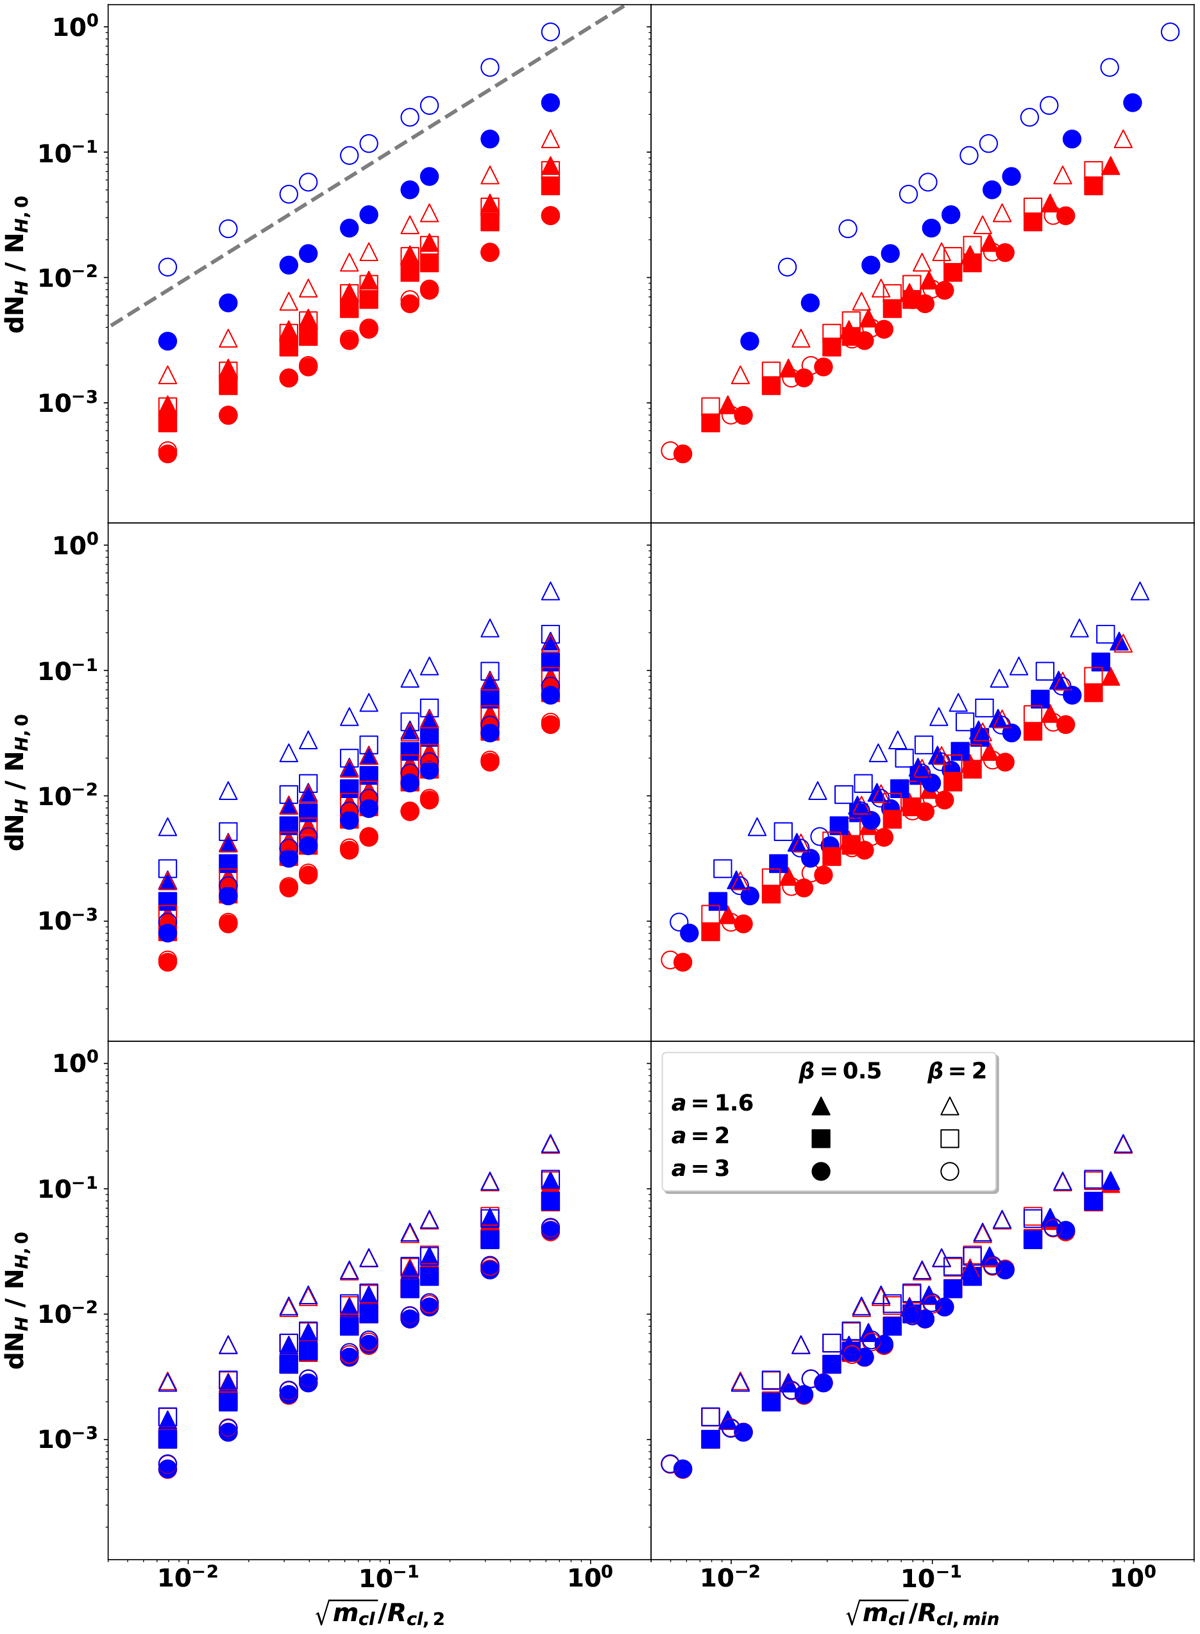
From top to bottom row: orbital inclination is 65°, 25°
and 0°.
Left column: standard deviation of the column density at inferior (resp. superior) conjunction in red (resp.blue) as a function of the ratio ![]() . Each couple (a, β) leads to a different proportionality constant between δNH
and
. Each couple (a, β) leads to a different proportionality constant between δNH
and ![]() , hence the large dispersion. The dashed line in the top left panel indicates the y = x line. Right column: same as before but Rcl,2 has been replaced by the clump radius at the point along the LOS between the X-ray source and the observer the closest from the donor star. The dispersion is reduced, especially at inferior conjunction.
, hence the large dispersion. The dashed line in the top left panel indicates the y = x line. Right column: same as before but Rcl,2 has been replaced by the clump radius at the point along the LOS between the X-ray source and the observer the closest from the donor star. The dispersion is reduced, especially at inferior conjunction.
Current usage metrics show cumulative count of Article Views (full-text article views including HTML views, PDF and ePub downloads, according to the available data) and Abstracts Views on Vision4Press platform.
Data correspond to usage on the plateform after 2015. The current usage metrics is available 48-96 hours after online publication and is updated daily on week days.
Initial download of the metrics may take a while.