Fig. 4

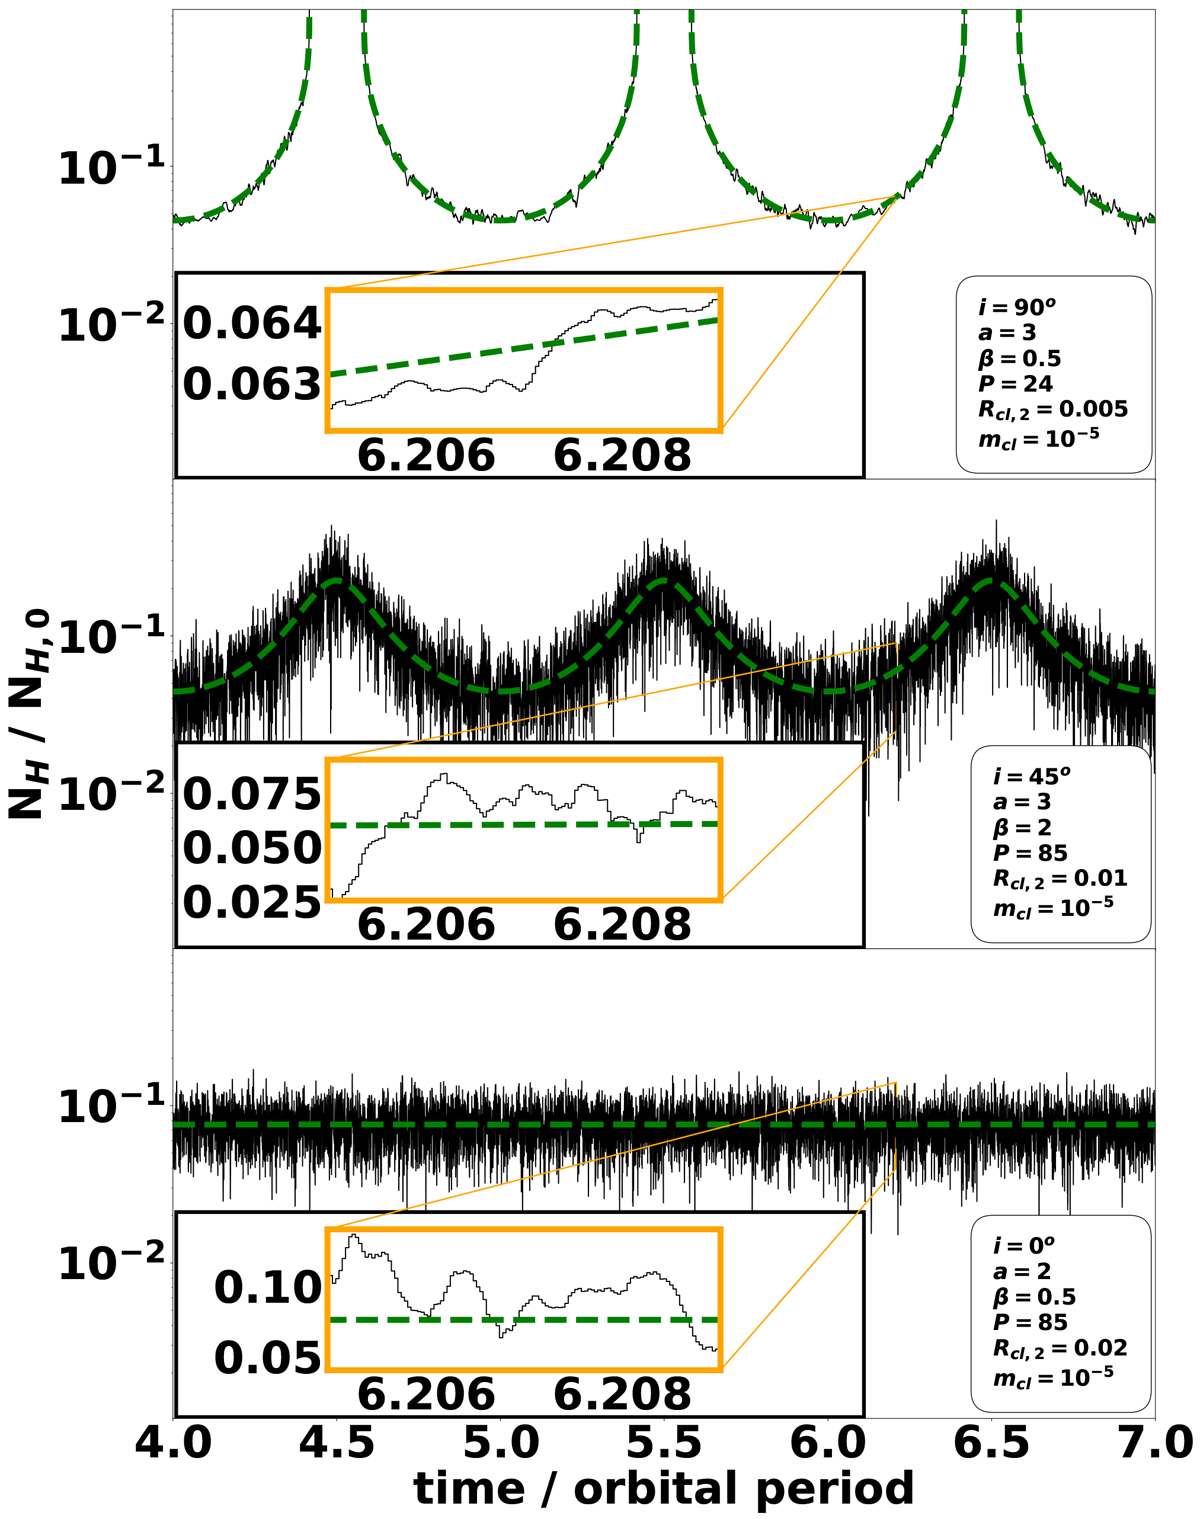
Three different evolutions of the column density as a function of time over several orbits for i = 90° (top panel), i = 45° (middle panel) and i = 0° (bottom panel) – and different clump radii, orbital separations, periods and β exponent.The dashed green line is the corresponding smooth wind column density profile. The top profile displays eclipses due to the high inclination. The insets show zoomed in portions of the curves where the numerical time sampling of the column density, 3 × 10⁴ times per orbital period, is visible. The origin of time is set at inferior conjunction (i.e., t = 0 at ϕ = 0.5).
Current usage metrics show cumulative count of Article Views (full-text article views including HTML views, PDF and ePub downloads, according to the available data) and Abstracts Views on Vision4Press platform.
Data correspond to usage on the plateform after 2015. The current usage metrics is available 48-96 hours after online publication and is updated daily on week days.
Initial download of the metrics may take a while.


