Fig. 1
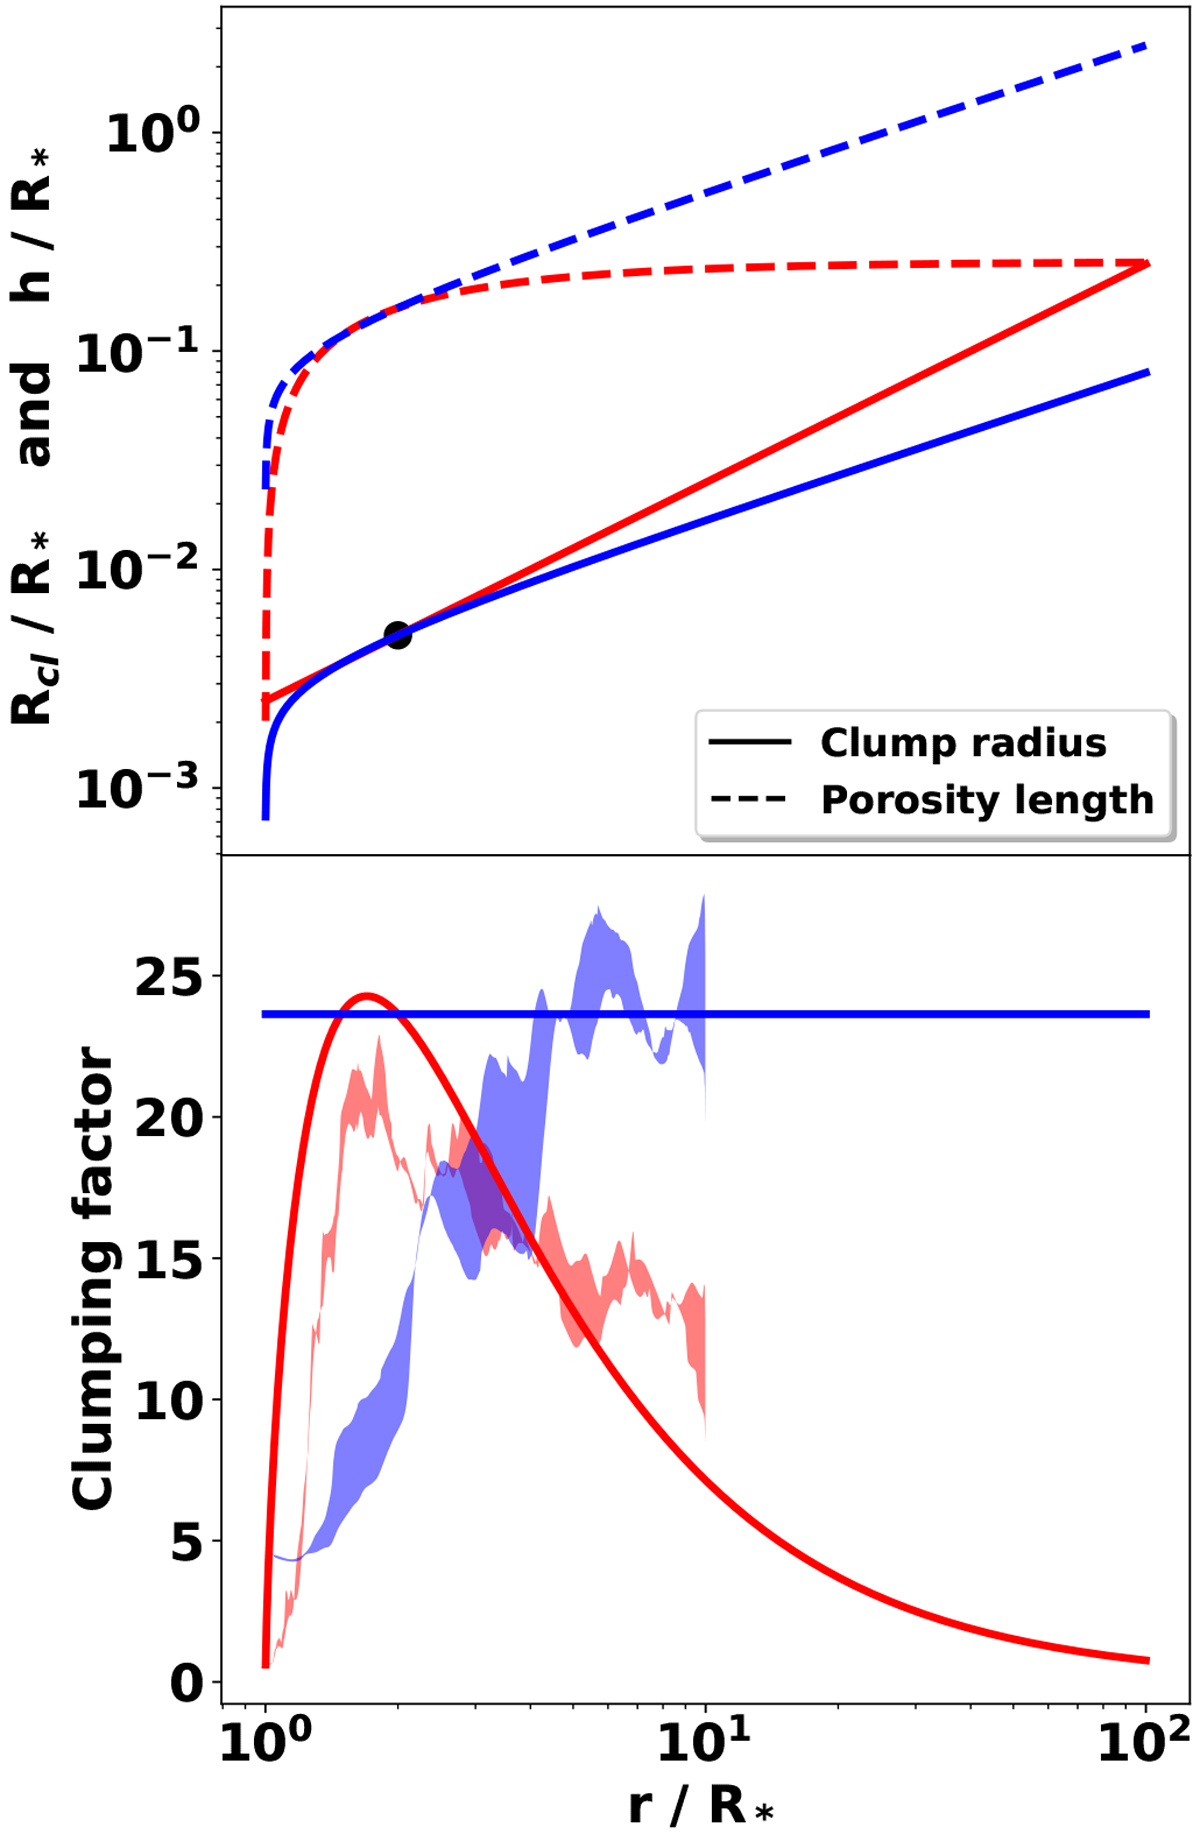
Top panel: clump radius (solid lines) and porosity length (dashed lines) in units of R* as a function of the distance to the stellar center. In blue (resp. in red) are represented the profiles for the clump radius expansion law (4) (resp. Eq. (5)). The dimensionless clump radius at r = 2, indicated with a black dot, was set to 0.005, and the dimensionless clump mass to 4 × 10⁻⁷ (see Sect. 2.4 for normalization units). Bottom panel: clumping factor profiles for both expansion laws. The red (resp. blue) shaded region represents the shape of the clumping factor profile obtained for O (resp. B) supergiants by Driessen et al. (2019). Spectroscopically, these OB supergiants can be considered representing typical early- and middle-type stars.
Current usage metrics show cumulative count of Article Views (full-text article views including HTML views, PDF and ePub downloads, according to the available data) and Abstracts Views on Vision4Press platform.
Data correspond to usage on the plateform after 2015. The current usage metrics is available 48-96 hours after online publication and is updated daily on week days.
Initial download of the metrics may take a while.