Fig. C.1
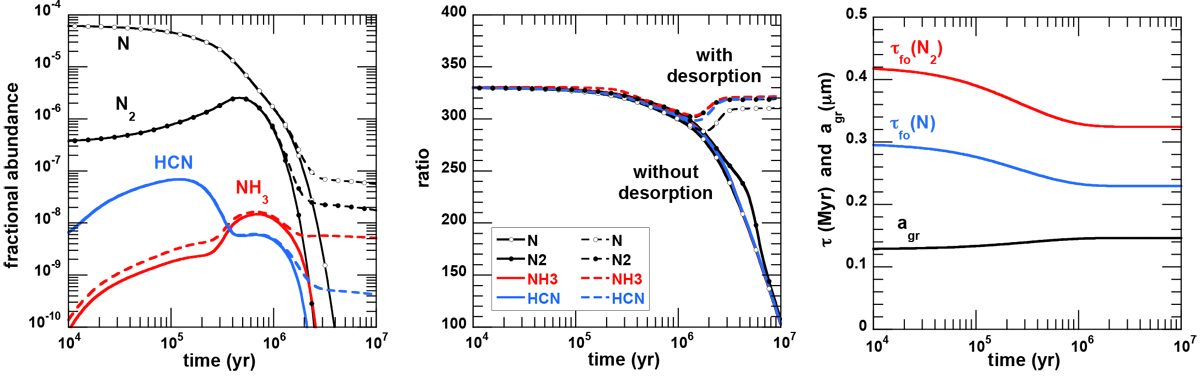
Left panel: temporal evolution of the abundances of N, N2, HCN, and NH3 in a constant density model with our fiducial parameters (see Sect. 2.3) and using the R15 rates. Middle panel: same for the isotopic ratios. The full curves are for models with adsorption only, while dashed curves are for models with both adsorption and desorption. Right panel: temporal evolution of the freeze-out timescales τfo of N and N2 and of the dust grain radius agr.
Current usage metrics show cumulative count of Article Views (full-text article views including HTML views, PDF and ePub downloads, according to the available data) and Abstracts Views on Vision4Press platform.
Data correspond to usage on the plateform after 2015. The current usage metrics is available 48-96 hours after online publication and is updated daily on week days.
Initial download of the metrics may take a while.