Fig. A.1
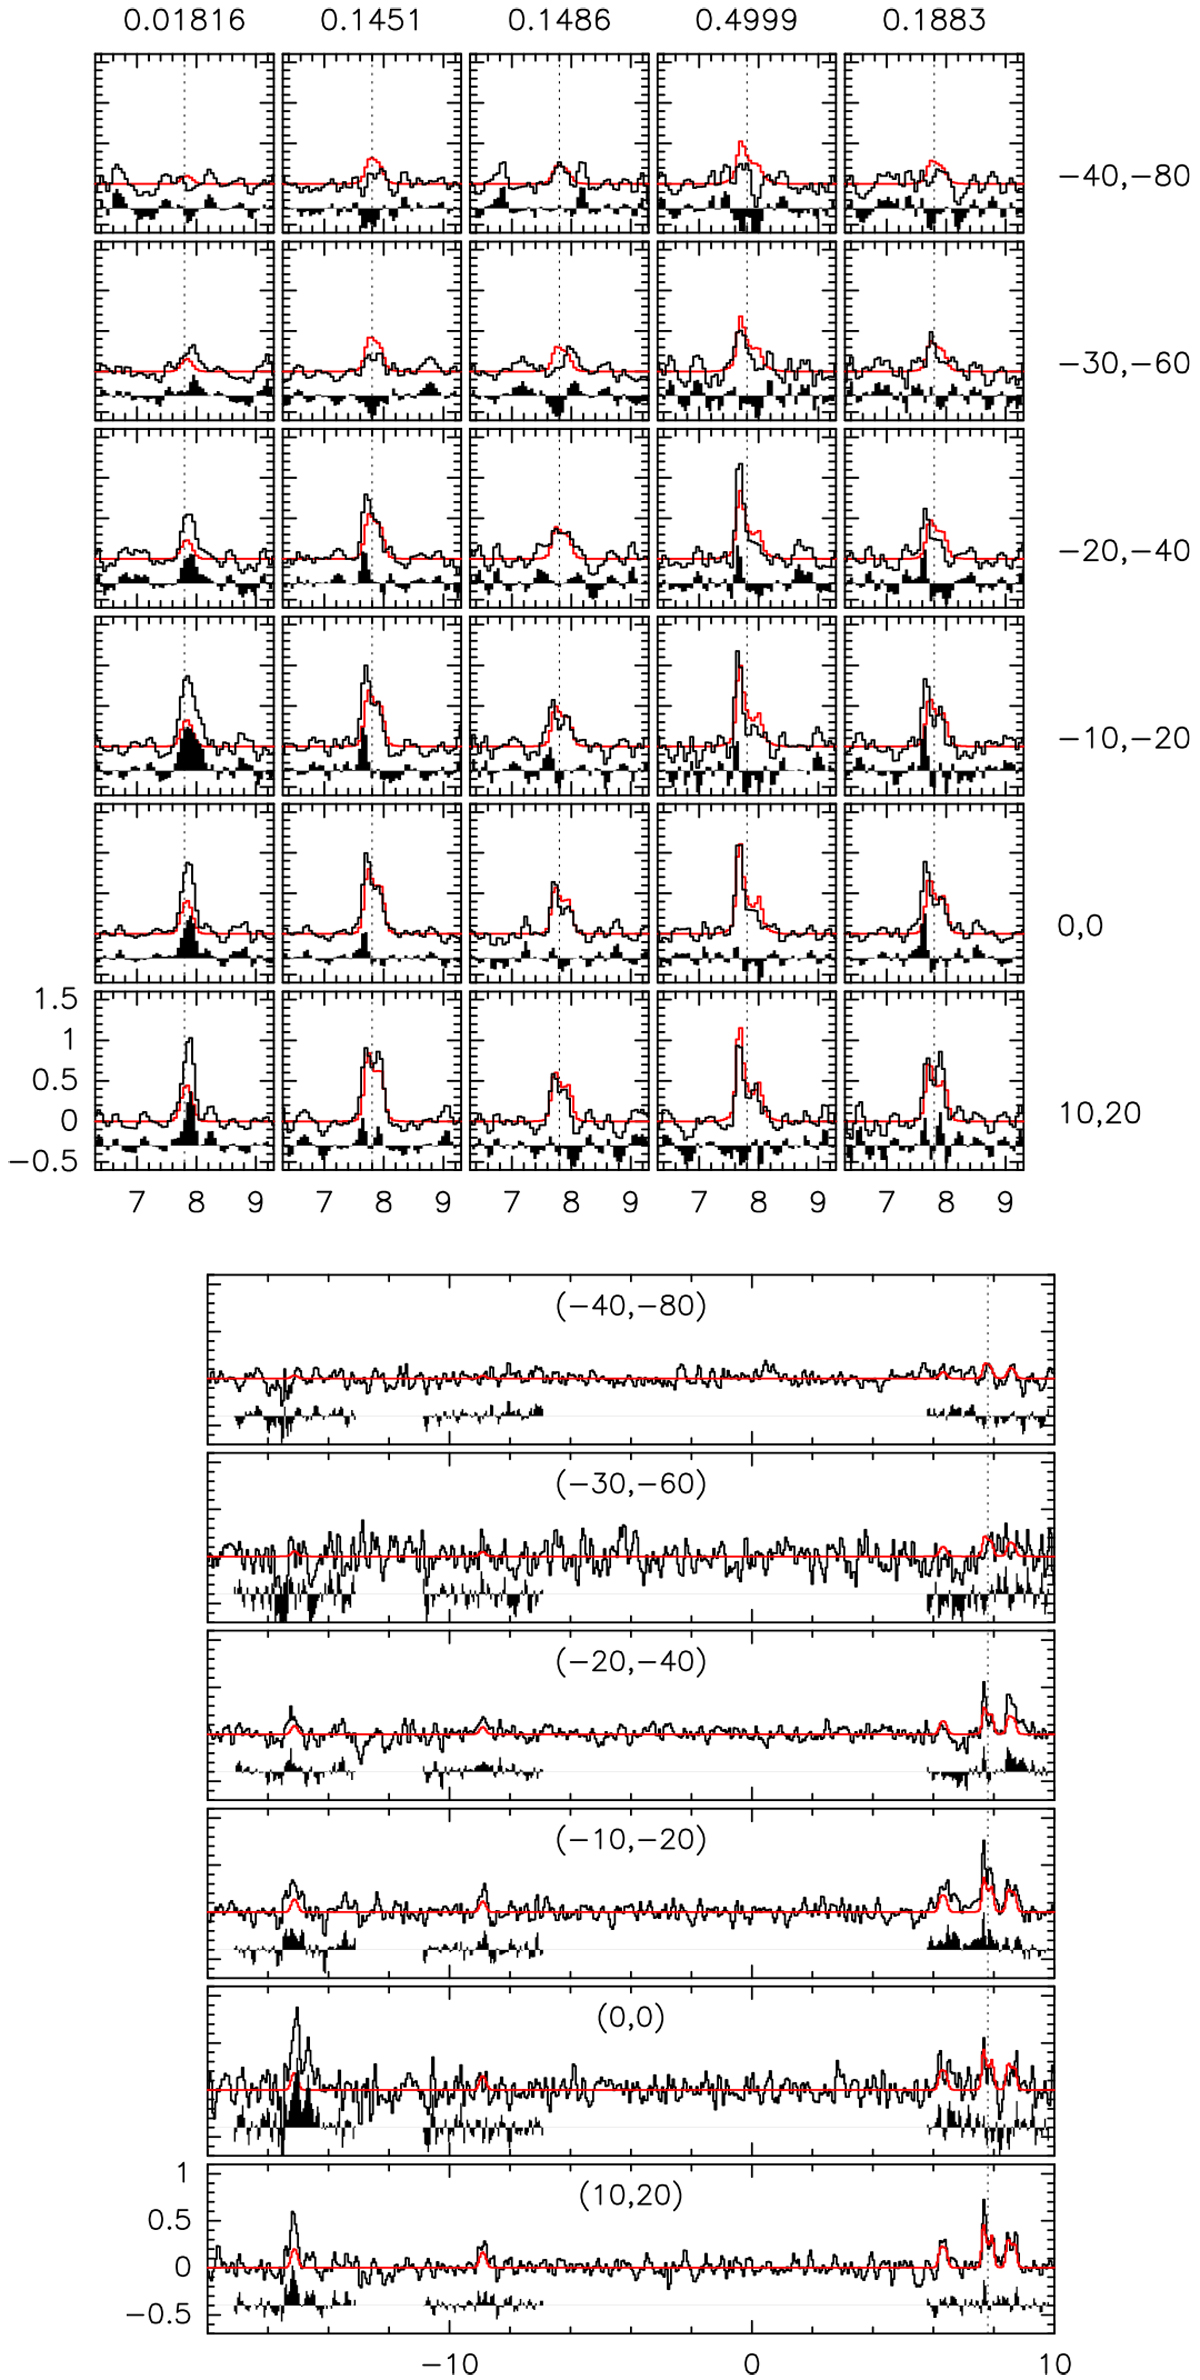
Observed hyperfine manifolds of CN(1–0) at 113.5 GHz (top) and of CN(2–1) at (bottom) toward L1498 as measured with the IRAM-30m telescope (Hily-Blant et al. 2010). For CN(1–0), the five hyperfine lines are shown separately, with their relative intensity indicated at the top. The best-fit model is shown in red, and the residuals are shown below each spectrum. The offsets are indicated on the right of each panel. The x-axis is the LSR velocity, and the intensity is on a main-beam temperature scale.
Current usage metrics show cumulative count of Article Views (full-text article views including HTML views, PDF and ePub downloads, according to the available data) and Abstracts Views on Vision4Press platform.
Data correspond to usage on the plateform after 2015. The current usage metrics is available 48-96 hours after online publication and is updated daily on week days.
Initial download of the metrics may take a while.