Fig. 9
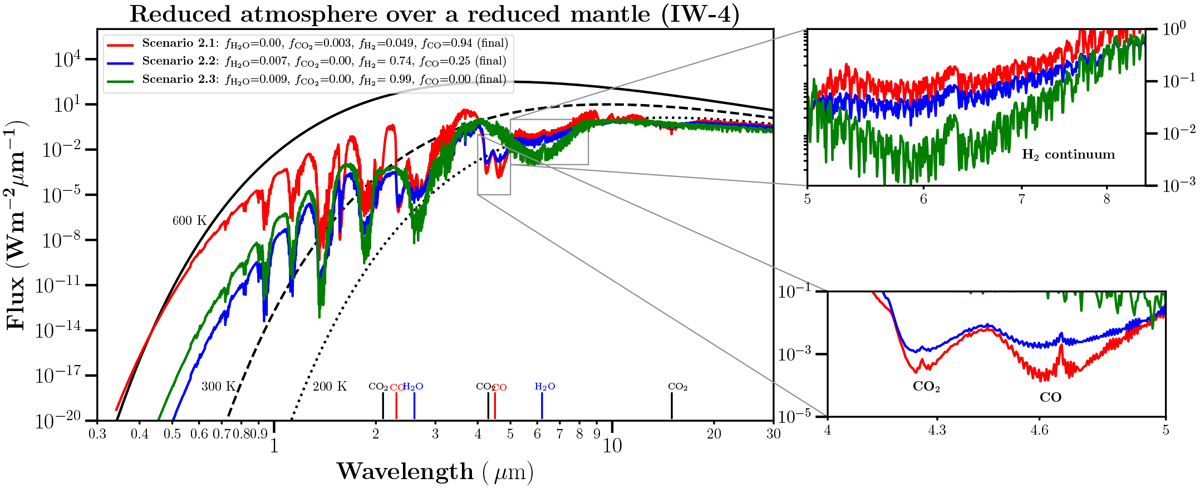
Thermal spectral emission for a reducing atmosphere overlying a reduced mantle (IW-4) for scenarios 2.1, 2.2, and 2.3 of Table 5. The legend shows the mole fraction of the outgassed species obtained from the speciation model. Prominent features of absorbing species are seen at wavelengths marked in the figure. Reference blackbody curves for three different surface temperatures are plotted. The insets show the zoomed-in thermal spectra with the most prominent absorption features of CO2, CO and H2. The spectra have been binned to a resolution of λ∕Δλ = 1000.
Current usage metrics show cumulative count of Article Views (full-text article views including HTML views, PDF and ePub downloads, according to the available data) and Abstracts Views on Vision4Press platform.
Data correspond to usage on the plateform after 2015. The current usage metrics is available 48-96 hours after online publication and is updated daily on week days.
Initial download of the metrics may take a while.