Fig. 7
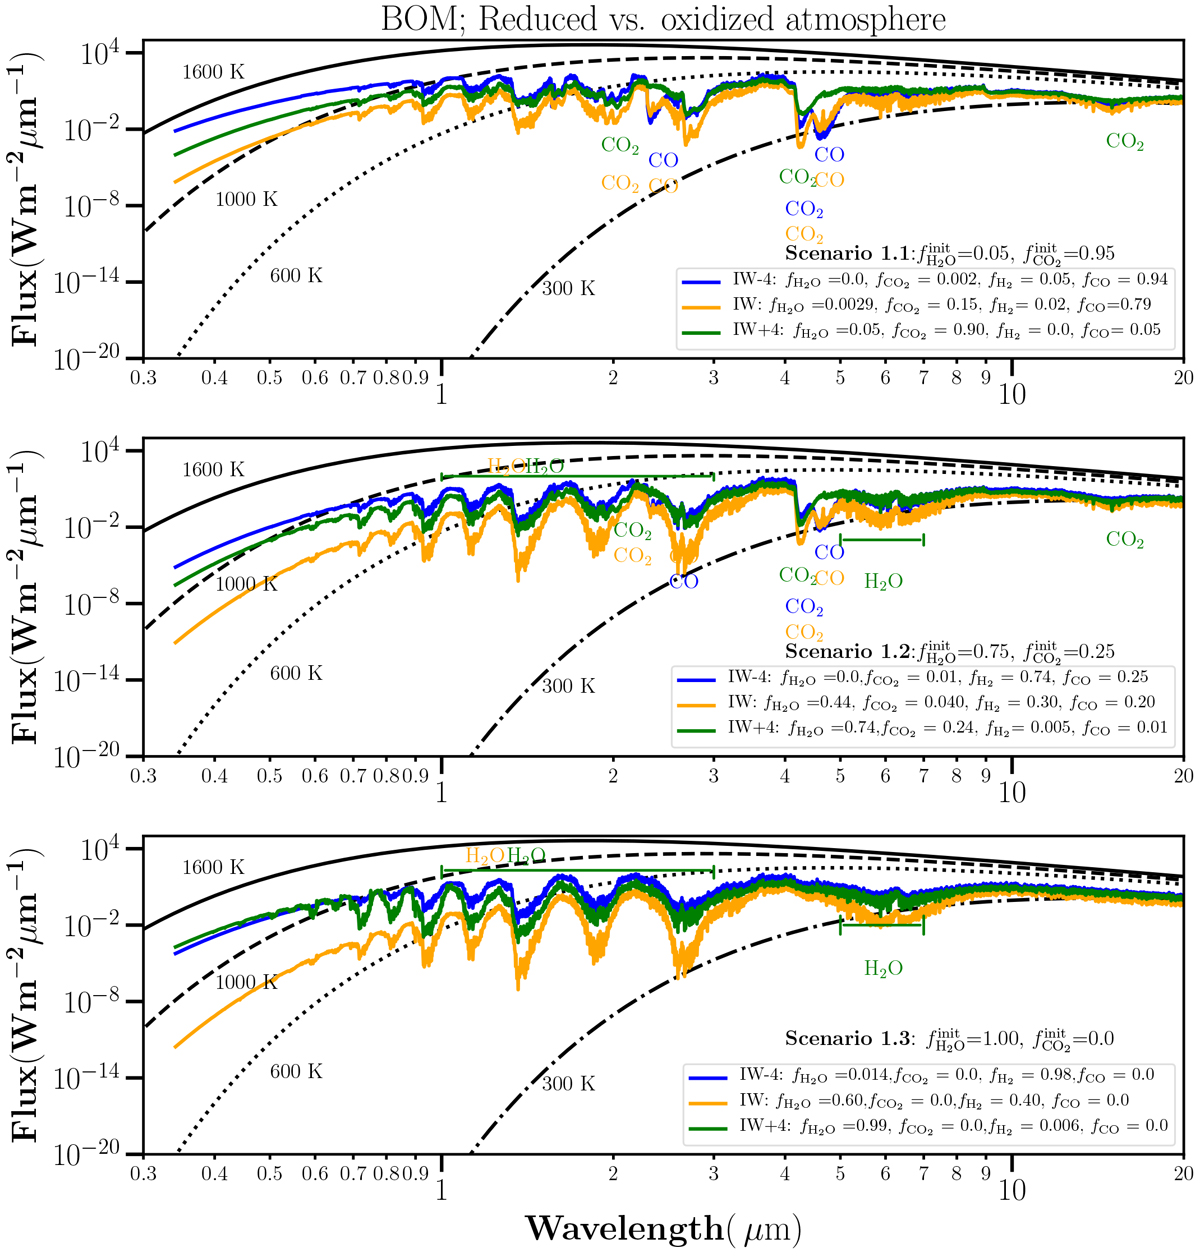
Comparison of thermal emission spectra for a reduced vs. an oxidized mantle during the BOM presented for scenario 1.1 (upper panel), 1.2 (middle panel), and 1.3 (lower panel) of Table 4. The output of the volatile speciation model is shown in the legend. Values written above the legend show the initial input values to the speciation model. Reference blackbody curves for four different temperatures are plotted. Absorption features ofkey chemical species are indicated. The spectra shown here have been binned to a resolution of λ∕Δλ = 1000.
Current usage metrics show cumulative count of Article Views (full-text article views including HTML views, PDF and ePub downloads, according to the available data) and Abstracts Views on Vision4Press platform.
Data correspond to usage on the plateform after 2015. The current usage metrics is available 48-96 hours after online publication and is updated daily on week days.
Initial download of the metrics may take a while.