Fig. 6
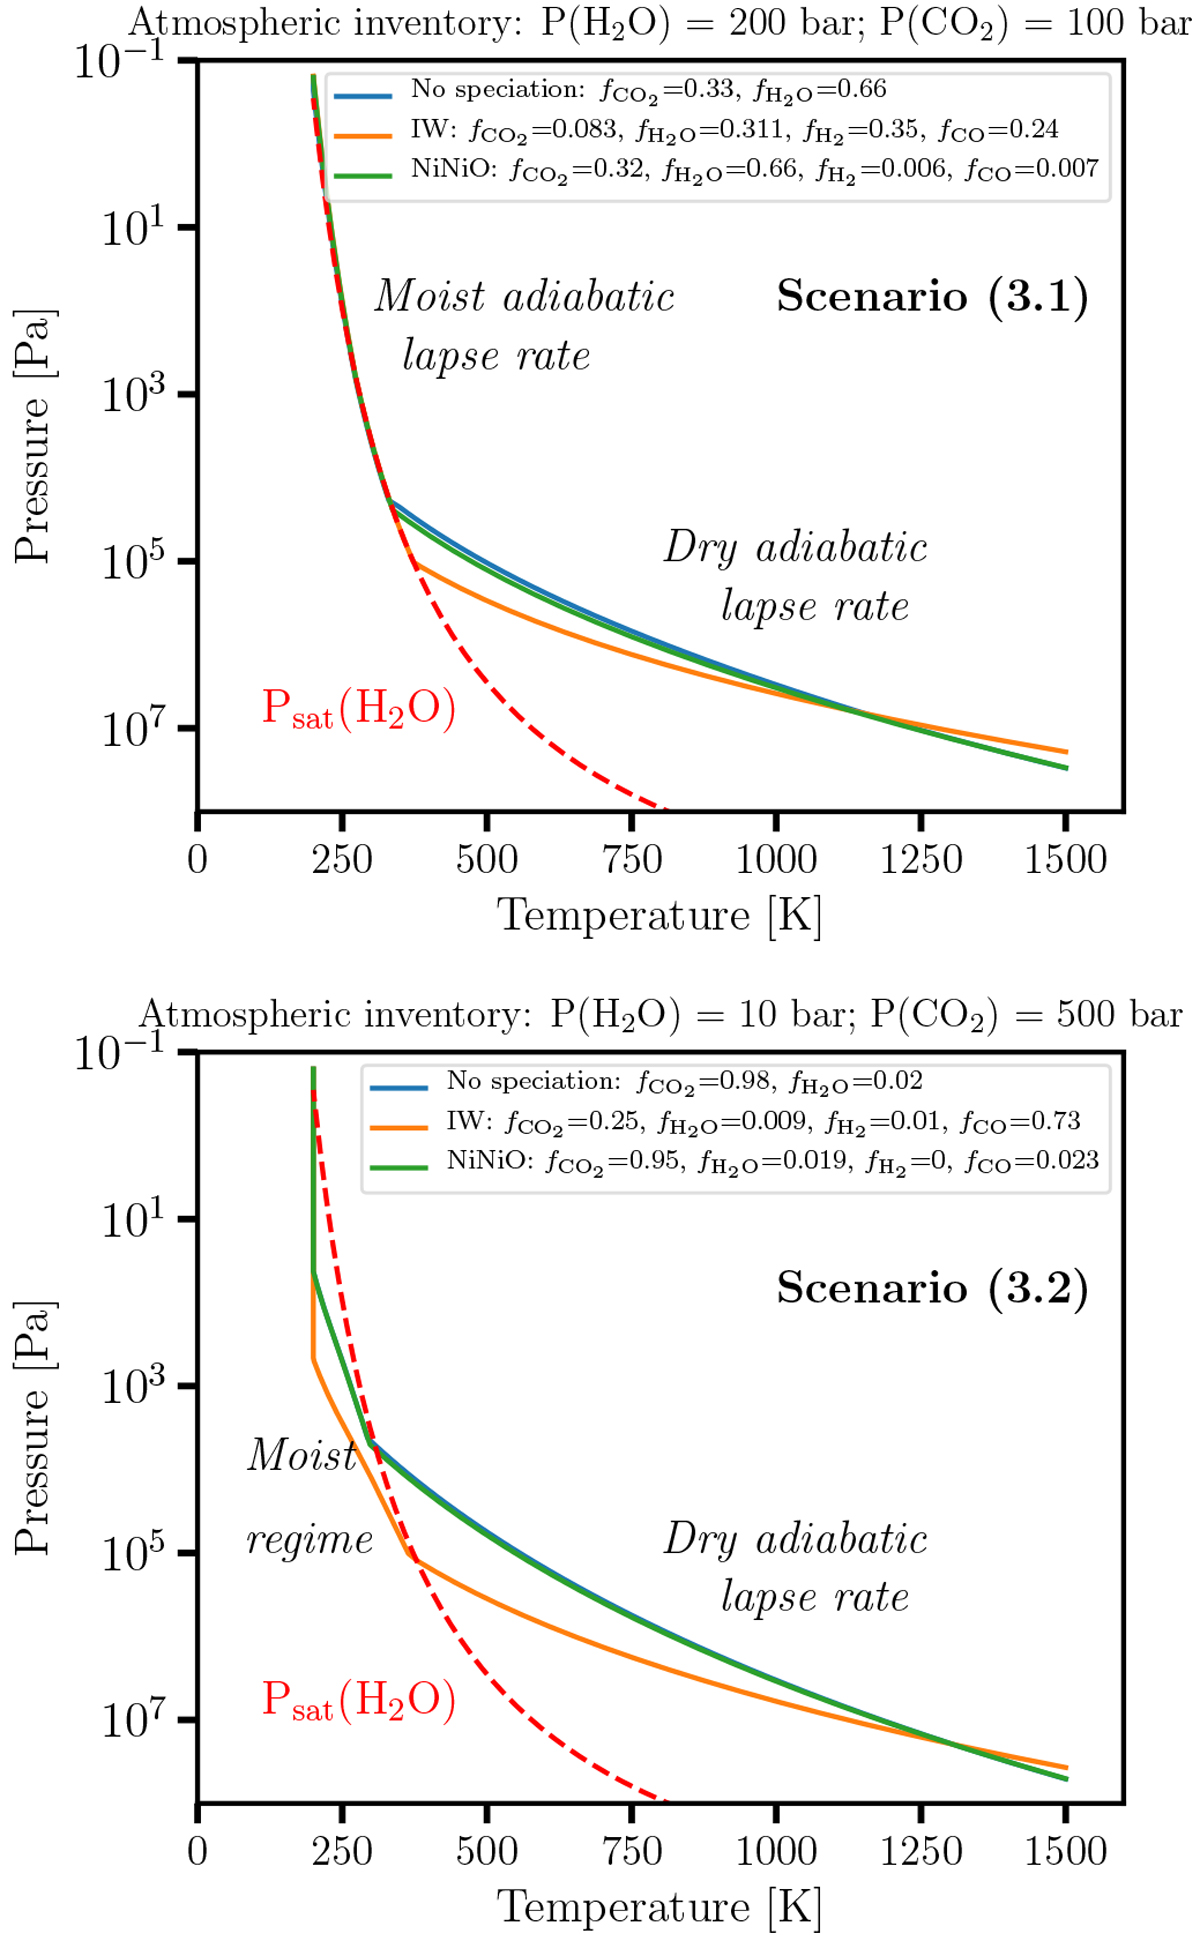
Temperature profiles p − T for scenario 3.1 (upper panel) with an initially H2O-dominated atmosphere and scenario 3.2 (lower panel) with an initially CO2-dominated atmosphere (Table 6). The molar fraction of each species is shown in the legend. “No speciation” indicates that the values were input directly by the user and were not calculated by the C-O-H speciation model.
Current usage metrics show cumulative count of Article Views (full-text article views including HTML views, PDF and ePub downloads, according to the available data) and Abstracts Views on Vision4Press platform.
Data correspond to usage on the plateform after 2015. The current usage metrics is available 48-96 hours after online publication and is updated daily on week days.
Initial download of the metrics may take a while.