Fig. 4
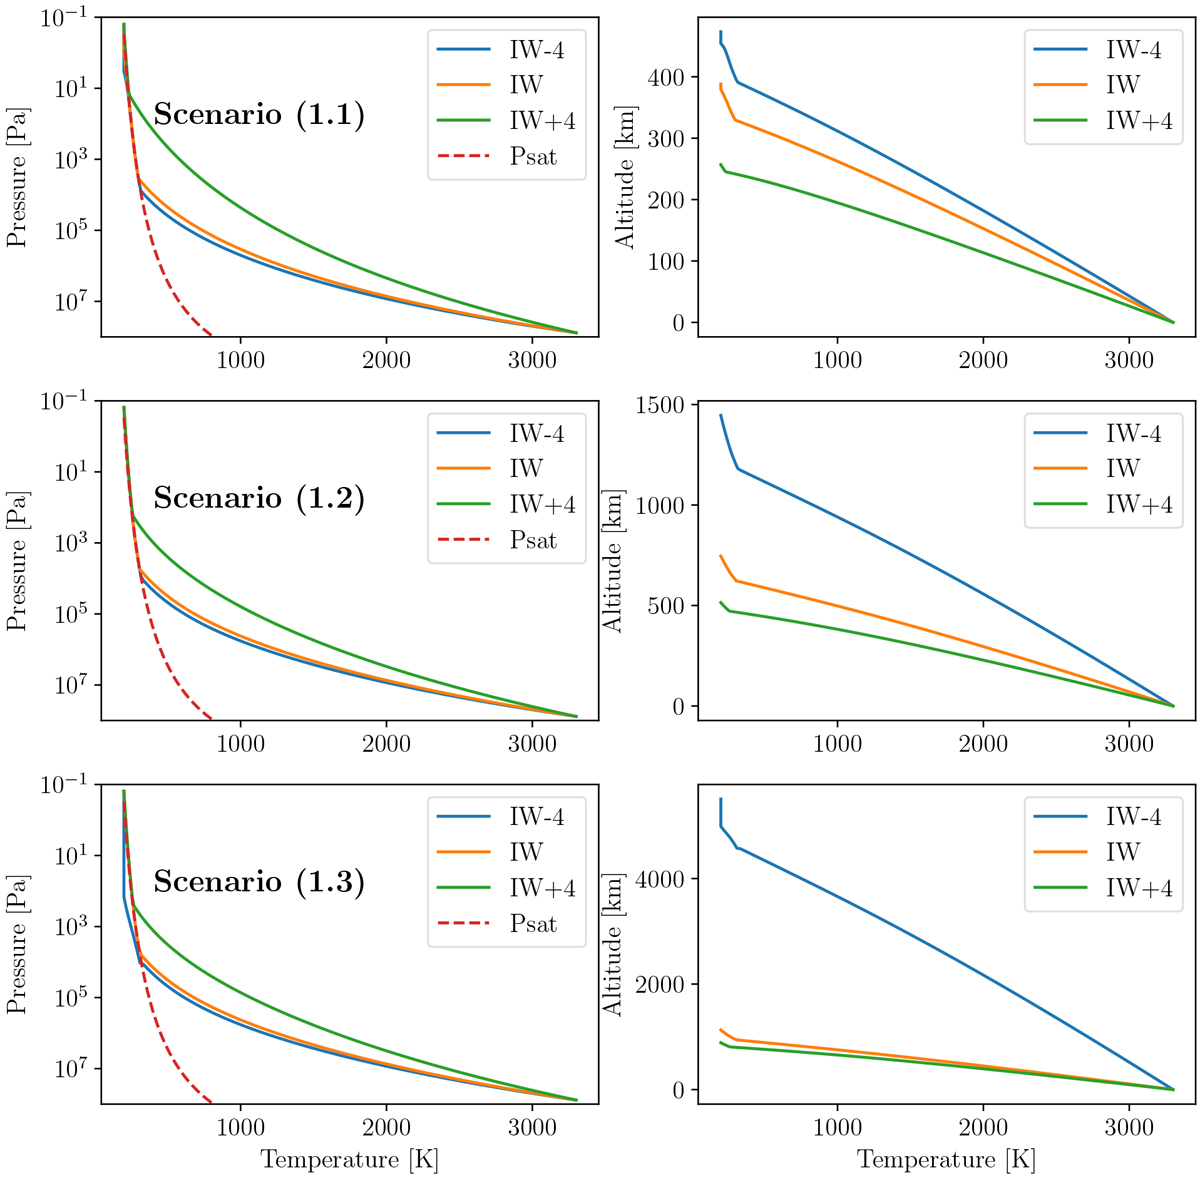
Left: pressure-temperature profiles for the BOM scenarios 1.1 (upper), 1.2 (middle), and 1.3 (lower panel) for three different buffers IW-4, IW, and IW+4. The dashed red line represents the saturation water vapor curve. Pressures at the bottom of atmosphere values are taken from Table 4. Right: altitude-temperature profiles for scenarios 1.1 (upper), 1.2 (middle), and 1.3 (lower panel). We note the different altitude ranges for the panels on the right.
Current usage metrics show cumulative count of Article Views (full-text article views including HTML views, PDF and ePub downloads, according to the available data) and Abstracts Views on Vision4Press platform.
Data correspond to usage on the plateform after 2015. The current usage metrics is available 48-96 hours after online publication and is updated daily on week days.
Initial download of the metrics may take a while.