Fig. 14
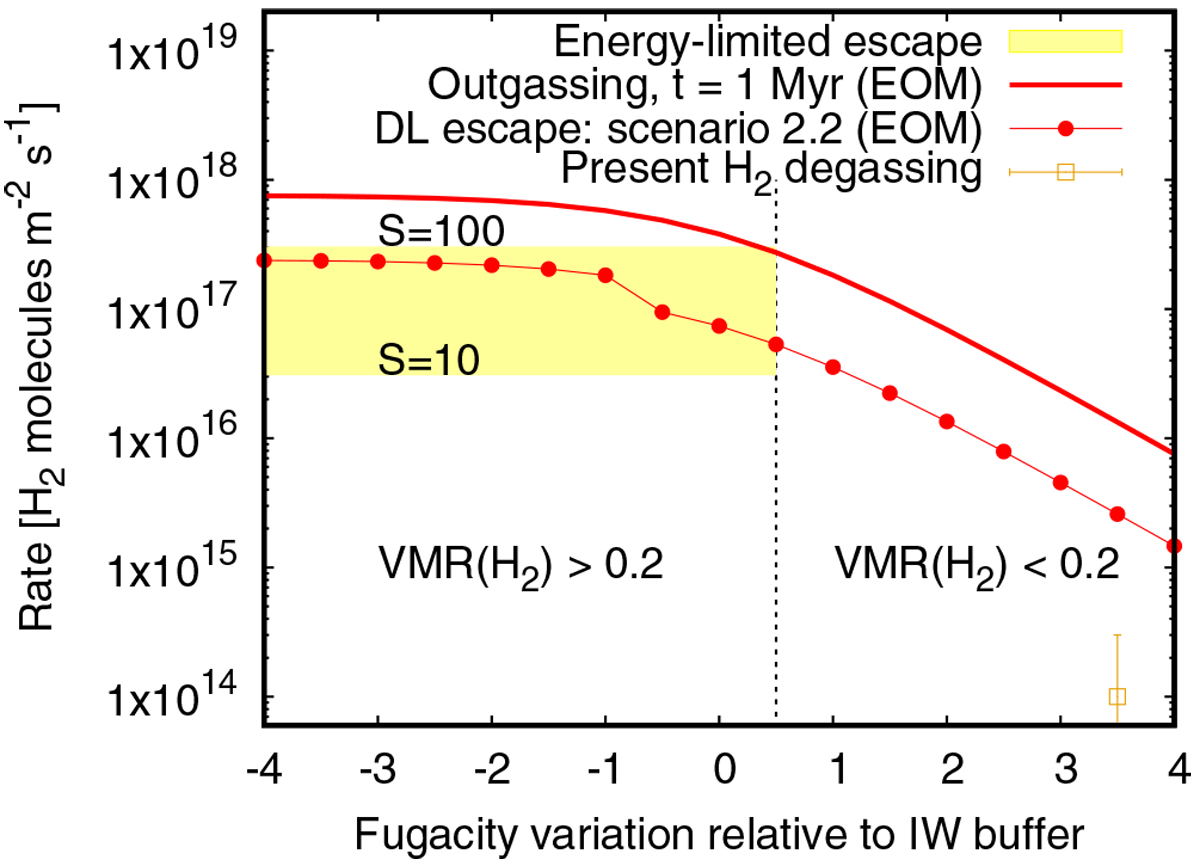
Hydrogen escape and outgassing rates as a function of redox state of the mantle for scenario 2.2 (EOM). The solid red line shows the H2 outgassing rate at the end of magma ocean. The closed red circles show the diffusion-limited escape of H2 for the EOM. The shaded region in yellow shows the loss rate due to energy-limited escape within the range S = 10 (lower boundary) to S = 100 (upper boundary) i.e. XUV relative to the modern value. The vertical dotted line marks the region separating a high H2 VMR to low H2 VMR and illustrates the most efficient escape process occurring. The present Earth H2 degassing rate with an uncertainty range (Ramirez et al. 2014) is marked for reference.
Current usage metrics show cumulative count of Article Views (full-text article views including HTML views, PDF and ePub downloads, according to the available data) and Abstracts Views on Vision4Press platform.
Data correspond to usage on the plateform after 2015. The current usage metrics is available 48-96 hours after online publication and is updated daily on week days.
Initial download of the metrics may take a while.