Fig. 13
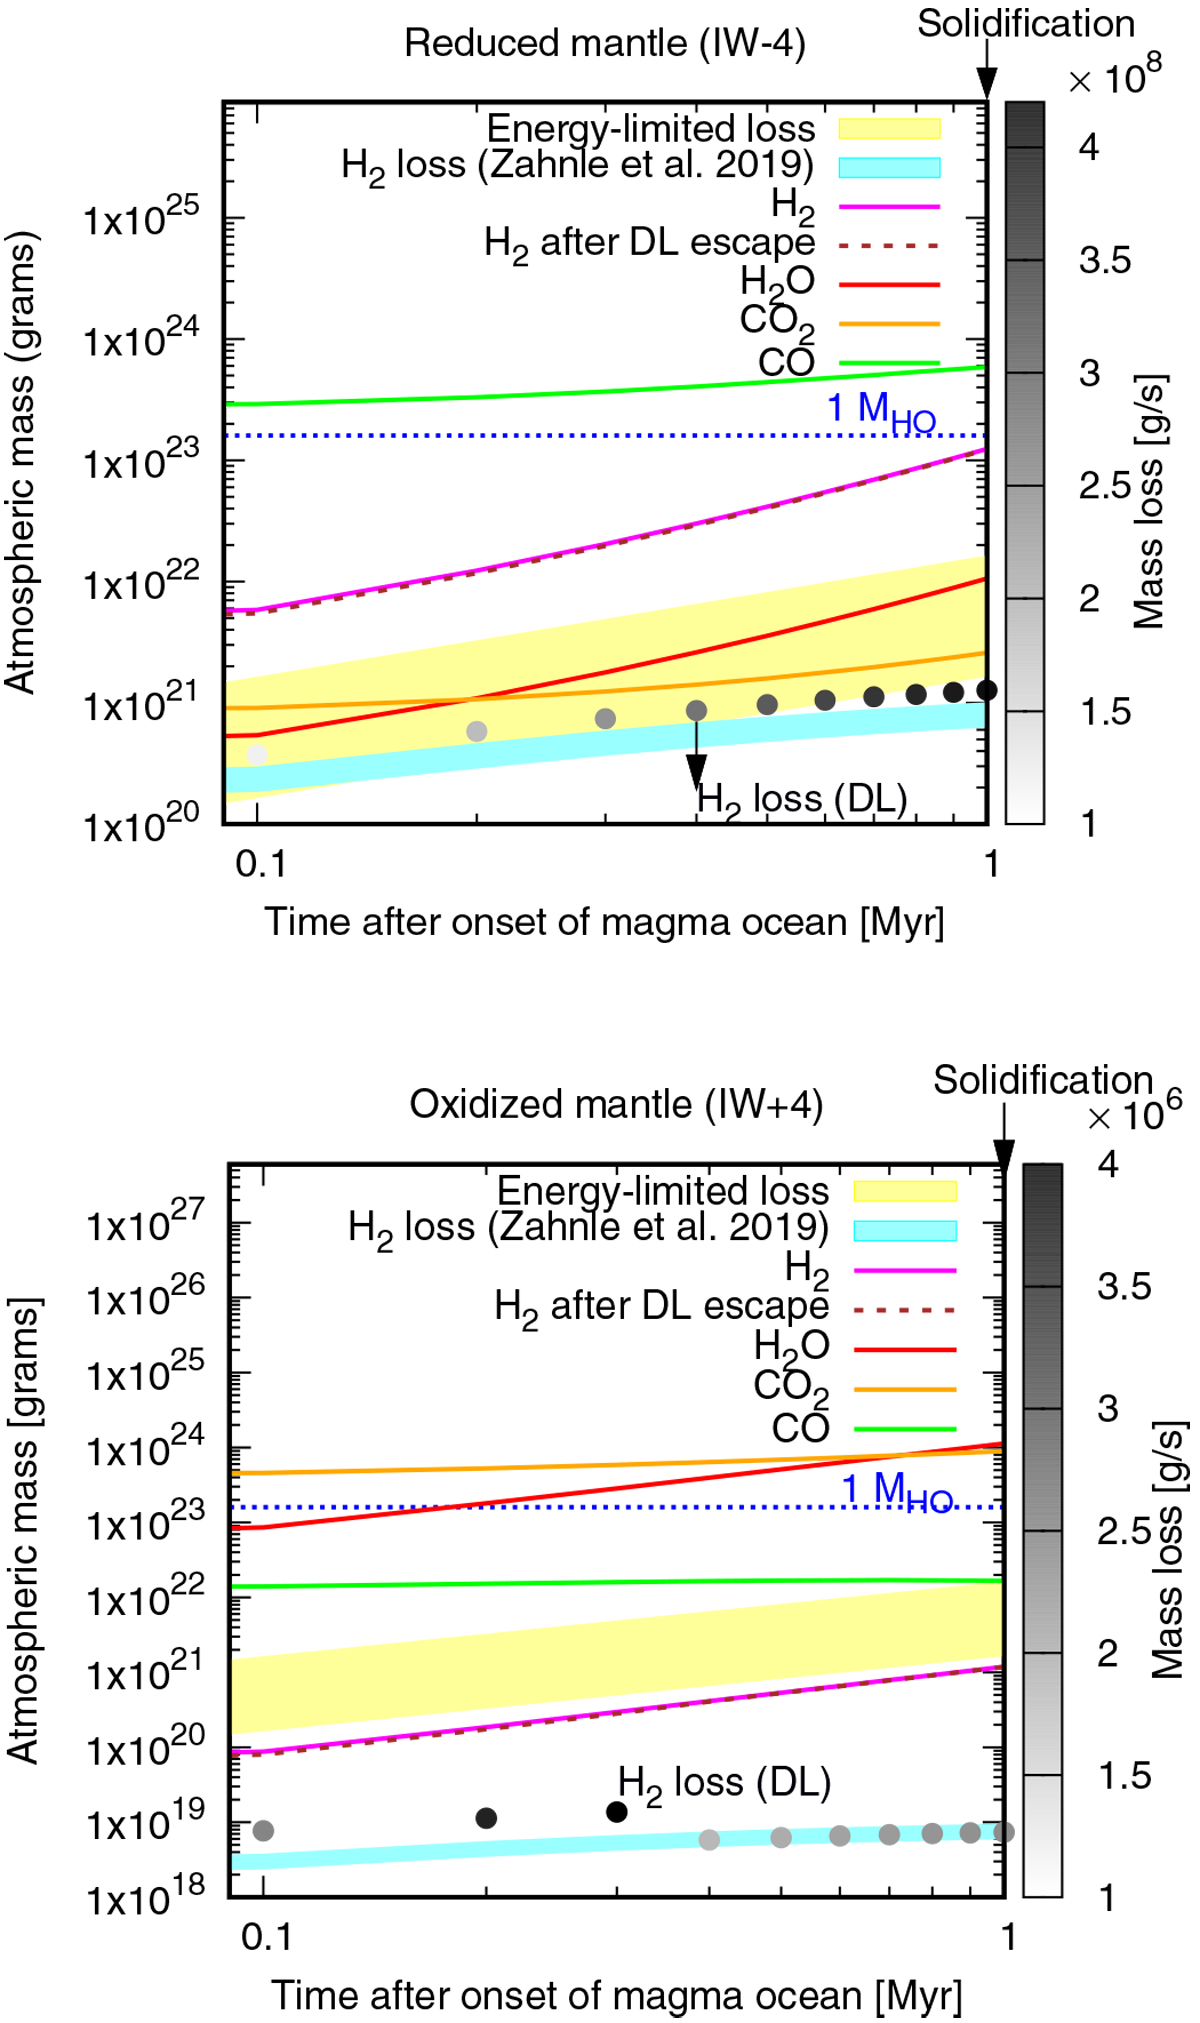
Evolution/escape of atmospheric species in terms of the atmospheric mass (left axis) for the duration of the magma ocean (x-axis) for a reduced mantle case (upper panel) and an oxidized mantle case (lower panel). The colored solid lines refer to atmospheric masses integrated over the whole planet that change due to outgassingand chemical speciation (see text). The dotted brown line shows the residual mass of H2 in the atmosphere after accounting for outgassing and DL escape. The shaded region in cyan shows the mass loss of H2 in the range for S = 10 to S = 100 (XUV relative to the modern value) using the Zahnle et al. (2019) best-fit formalism (see text). The shaded region in yellow shows the energy-limited loss of H2 for the lower range S = 10 to upper range S = 100. The dotted blue horizontal line shows the hydrogen content of one (modern) Earth ocean (MHO = 1.6 × 10²³ g). The filled circles indicate the escaping mass of H2 obtained using DL. The colors indicate the respective mass-loss rates (right axis).
Current usage metrics show cumulative count of Article Views (full-text article views including HTML views, PDF and ePub downloads, according to the available data) and Abstracts Views on Vision4Press platform.
Data correspond to usage on the plateform after 2015. The current usage metrics is available 48-96 hours after online publication and is updated daily on week days.
Initial download of the metrics may take a while.