Fig. 11
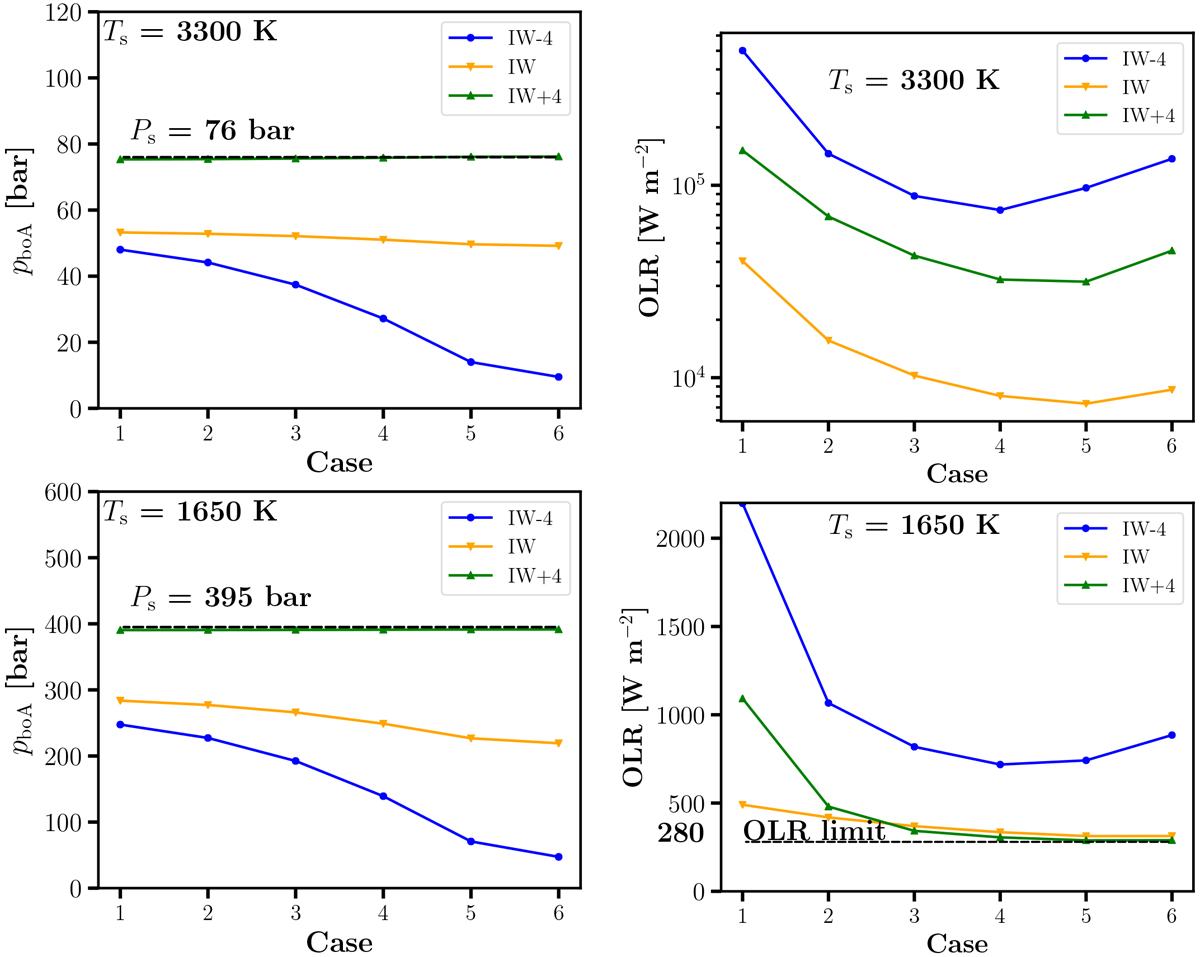
Left: pressure at the bottom of the atmosphere pboA for various cases referring to different initial volatile abundances and three different mantle buffers: reduced (IW-4), IW, and oxidized (IW+4). The details of speciation for various cases on the x-axis are shown in Table B.1 (Ts = 3300 K) and Table B.2 (Ts = 1650 K) in the Appendix B. The horizontal dashed black line indicates the total surface pressure of the initial outgassed volatile for the various cases. Right: outgoing longwave radiation (OLR) for various cases corresponding to the atmospheric surface pressure shown in the left panels and for three different buffers.
Current usage metrics show cumulative count of Article Views (full-text article views including HTML views, PDF and ePub downloads, according to the available data) and Abstracts Views on Vision4Press platform.
Data correspond to usage on the plateform after 2015. The current usage metrics is available 48-96 hours after online publication and is updated daily on week days.
Initial download of the metrics may take a while.