Fig. 3.
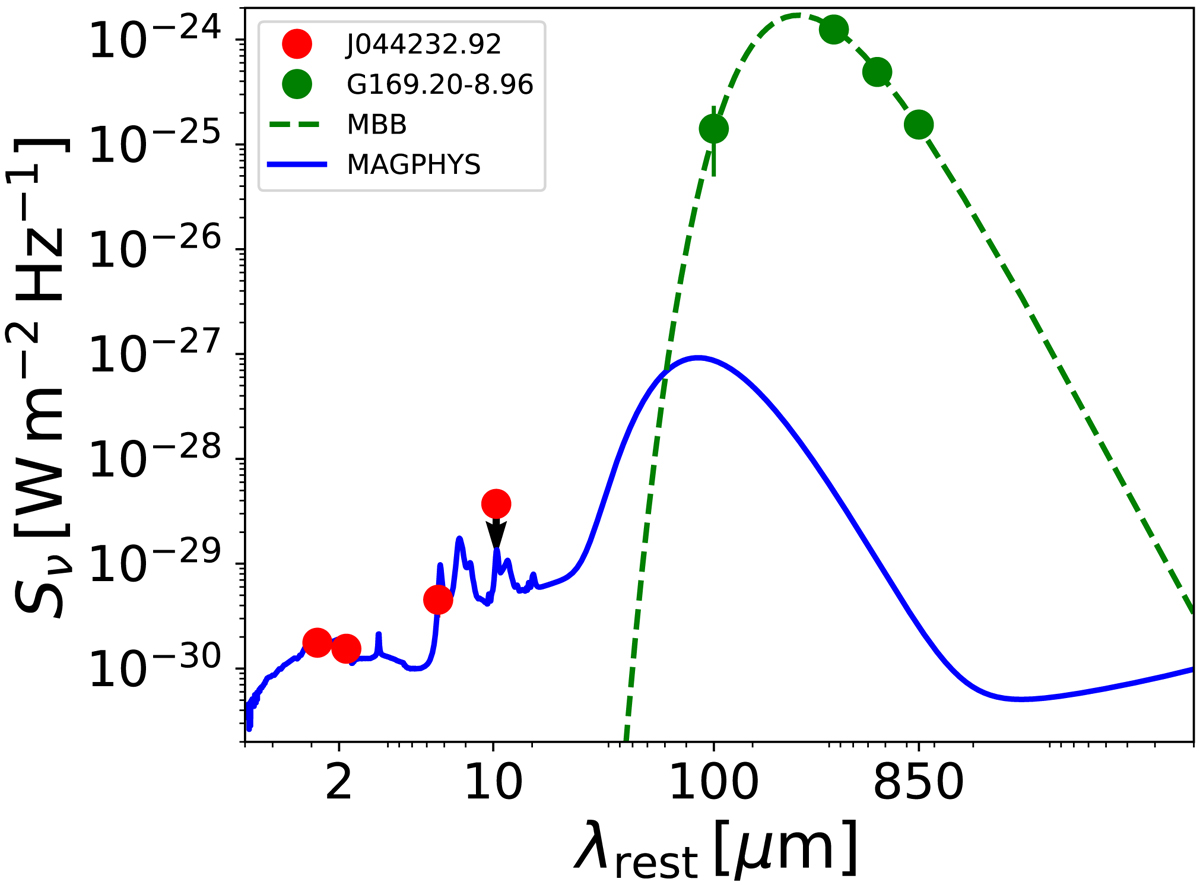
Best-fit rest-frame SED of J044232.92. The red points represent the observed photometric data points, and the one with a downwards pointing arrow marks the λobs = 22 μm upper flux density limit, which is taken into account in the fit. The blue line is the best-fit MAGPHYS+photo-z model SED (Battisti et al. 2019). For comparison, the far-IR to submillimetre SED of G169.20-8.96 is shown with green points indicating the IRAS 100 μm and Planck photometric data points and the green dashed line representing a single-temperature modified blackbody fit to those data (see text for details).
Current usage metrics show cumulative count of Article Views (full-text article views including HTML views, PDF and ePub downloads, according to the available data) and Abstracts Views on Vision4Press platform.
Data correspond to usage on the plateform after 2015. The current usage metrics is available 48-96 hours after online publication and is updated daily on week days.
Initial download of the metrics may take a while.