Fig. 8.
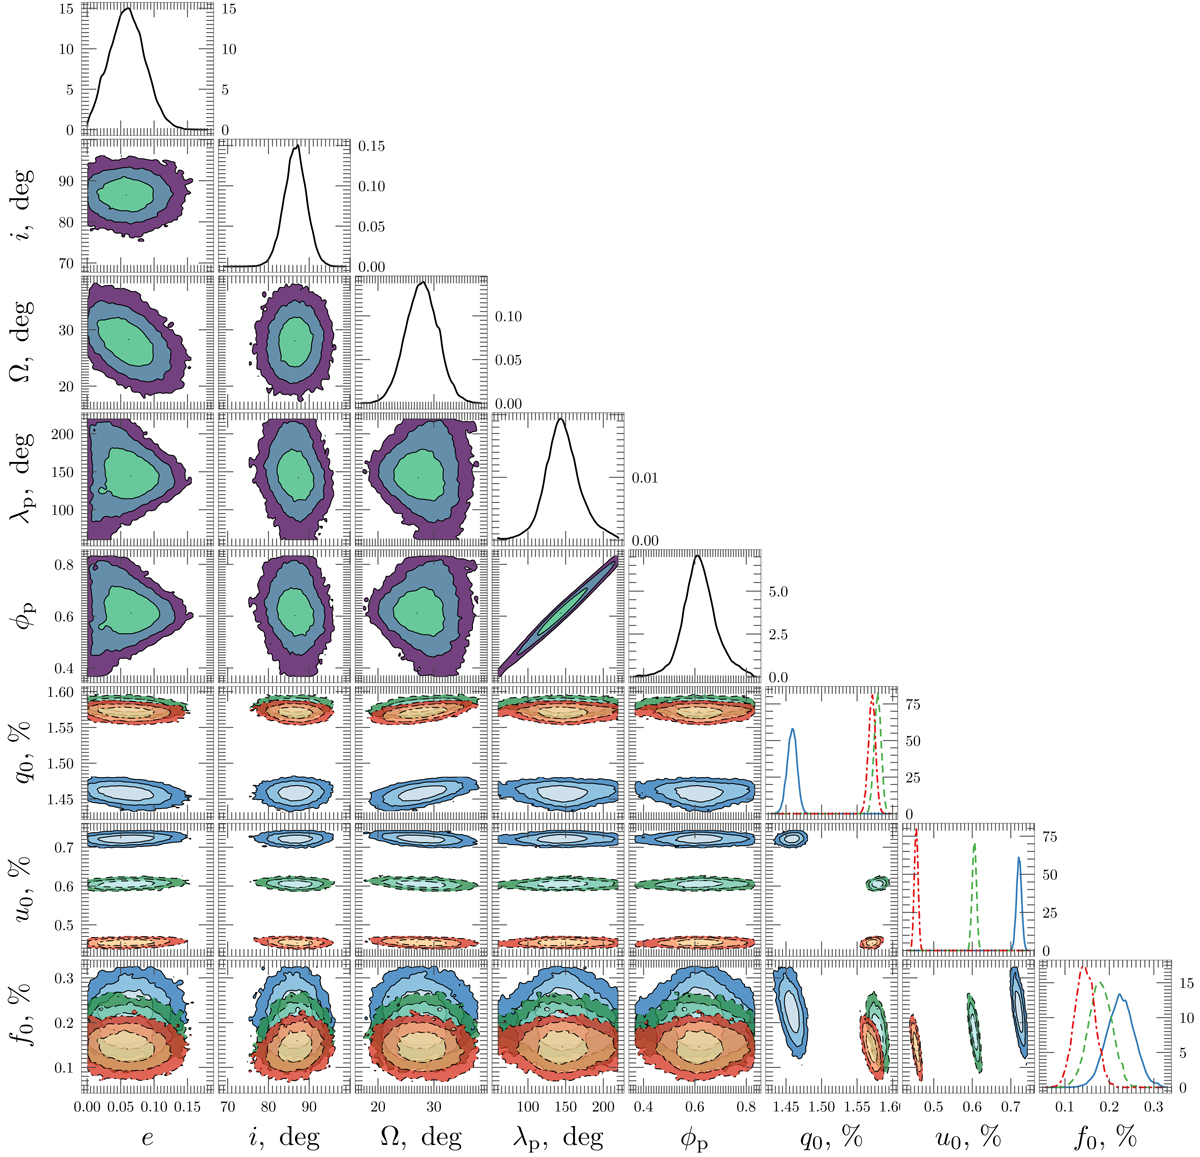
Posterior distributions for parameters of model described in Sect. 3.3 and Appendix A for Ω = θint ± 10°. Diagonal panels: distributions of model parameters. The blue solid, green dashed, and red dot-dashed lines correspond to per-passband B, V, and R distributions, respectively. Lower-triangle panels: joint posterior distributions of two parameters. The green, blue, and violet contours correspond to 0.68, 0.95, and 0.997 probability levels of parameters i, Ω, λp, and ϕp. The shades of blue, green, and red correspond to the same probability levels for B, V, and R filters, respectively.
Current usage metrics show cumulative count of Article Views (full-text article views including HTML views, PDF and ePub downloads, according to the available data) and Abstracts Views on Vision4Press platform.
Data correspond to usage on the plateform after 2015. The current usage metrics is available 48-96 hours after online publication and is updated daily on week days.
Initial download of the metrics may take a while.