Fig. 15.
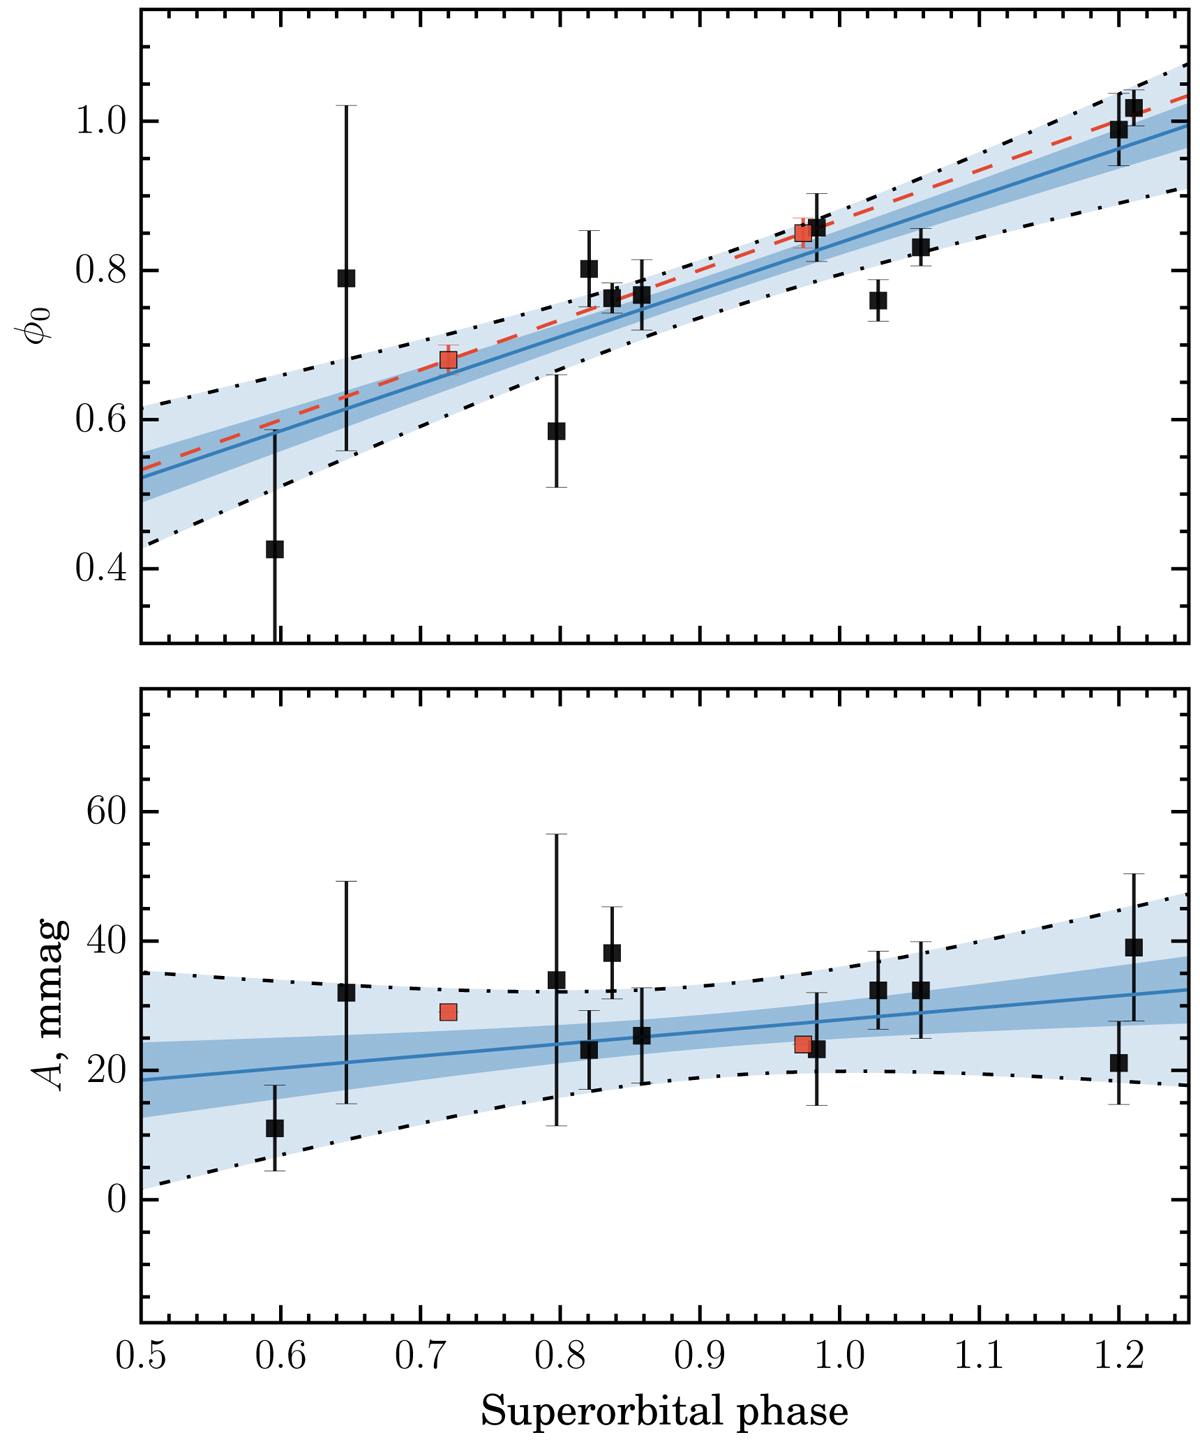
Dependence of brightness maximum orbital phase ϕ0 (top panel) and the amplitude A (bottom panel) of the sinusoidal fits on the superorbital phase. The solid blue lines correspond to the linear fit of the data, while the ±1σ and ±3σ confidence intervals are shown in dark and light blue. The red squares show the parameters from Table 3 of Paredes-Fortuny et al. (2015).
Current usage metrics show cumulative count of Article Views (full-text article views including HTML views, PDF and ePub downloads, according to the available data) and Abstracts Views on Vision4Press platform.
Data correspond to usage on the plateform after 2015. The current usage metrics is available 48-96 hours after online publication and is updated daily on week days.
Initial download of the metrics may take a while.