Fig. 14.
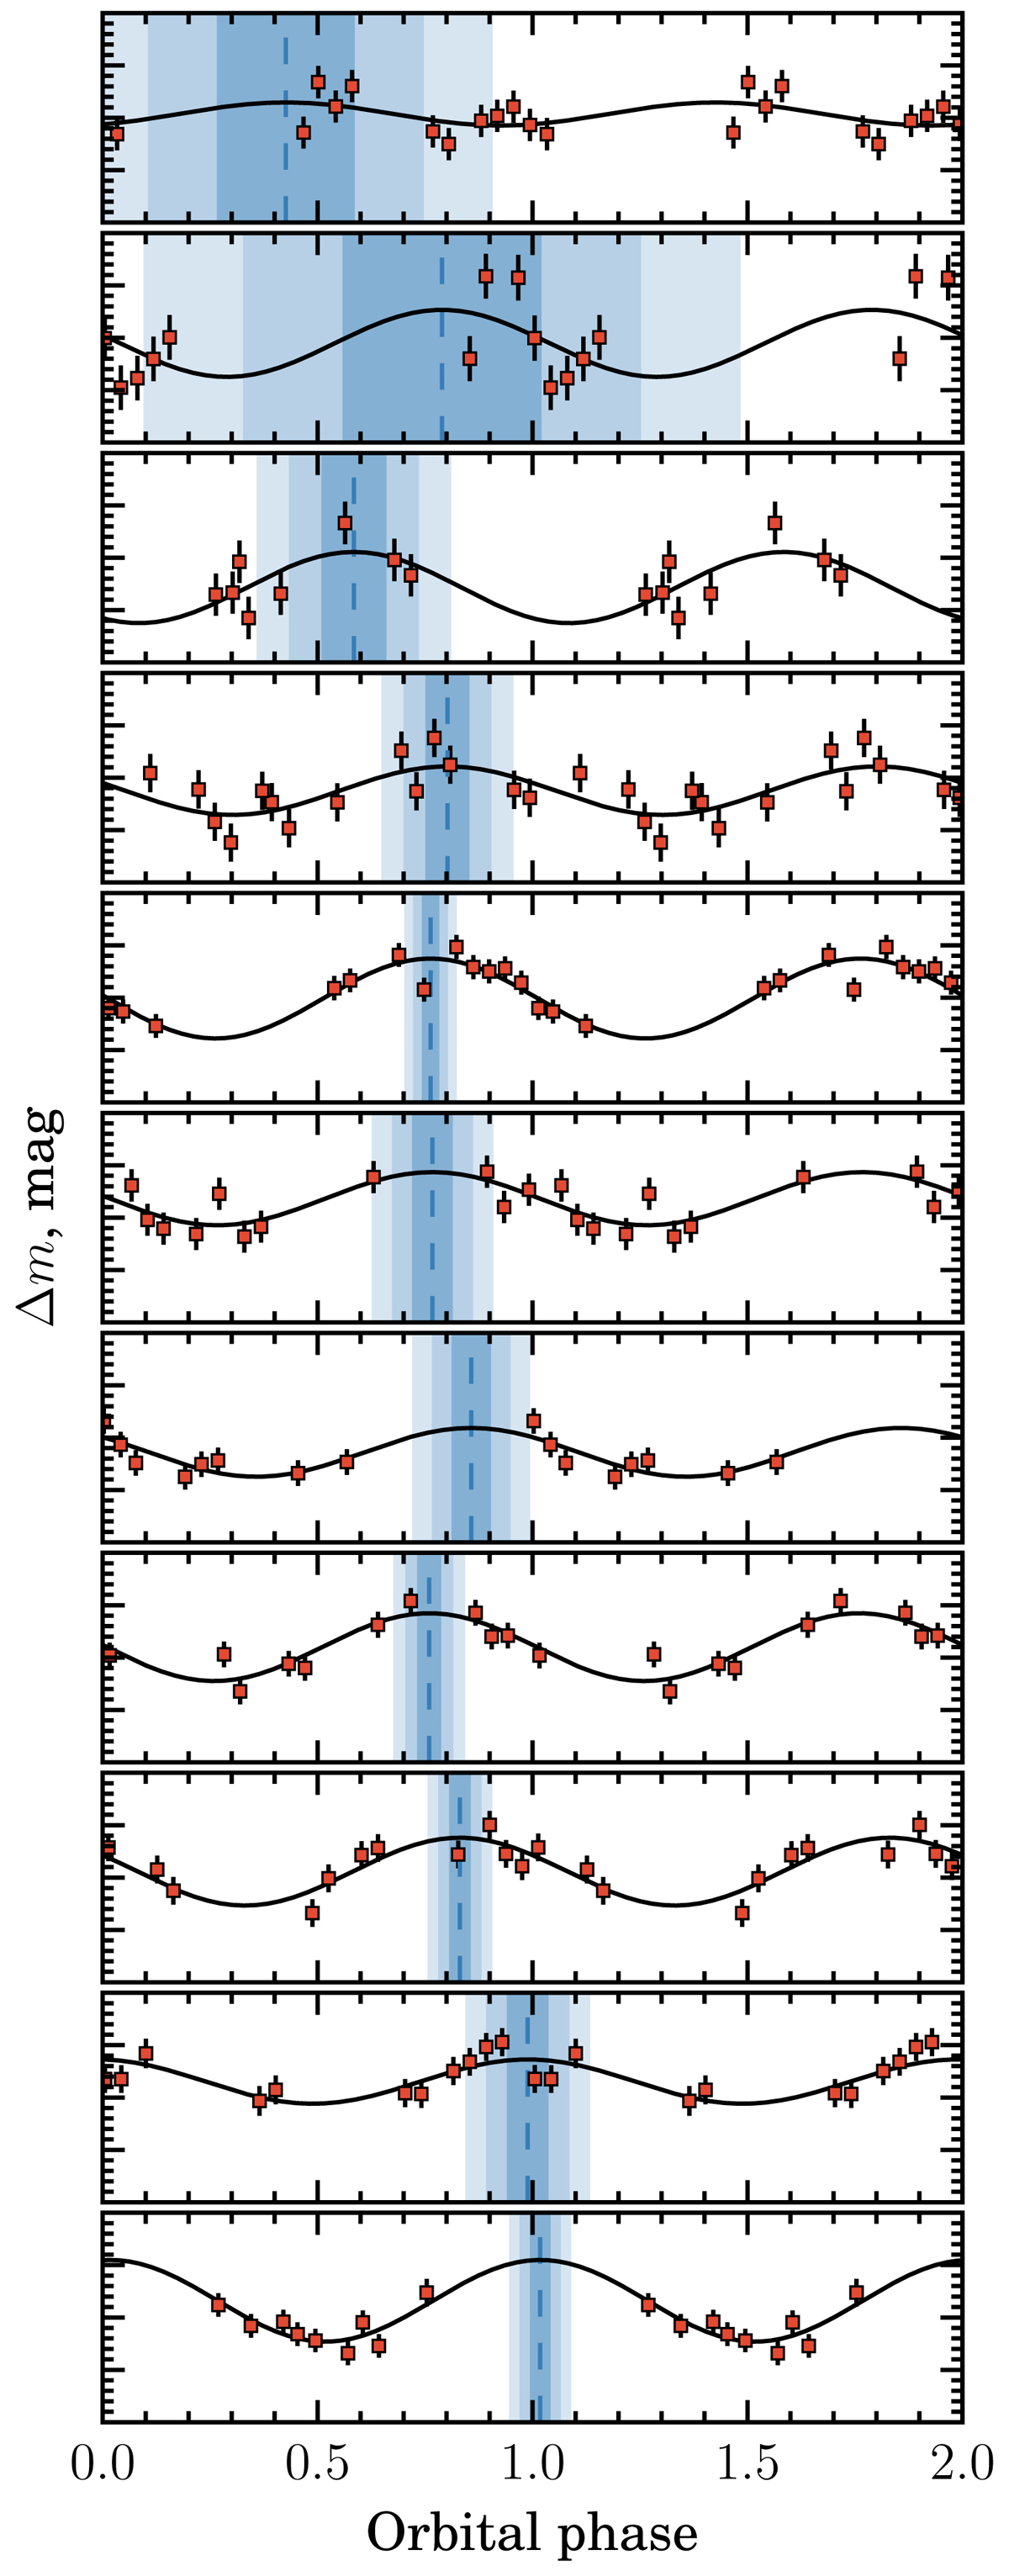
Variability of LS I +61° 303 optical brightness in V-band for different parts of the data (seasons S1–S11 from top to bottom). The black solid lines correspond to the best fit of the data with function (6). The vertical dashed lines give the phases of the best fit maxima ϕ0, and the corresponding ±1σ, ±2σ, and ±3σ confidence intervals are shown with varying shades of blue. The vertical scale [0.1, −0.1] is the same in all panels.
Current usage metrics show cumulative count of Article Views (full-text article views including HTML views, PDF and ePub downloads, according to the available data) and Abstracts Views on Vision4Press platform.
Data correspond to usage on the plateform after 2015. The current usage metrics is available 48-96 hours after online publication and is updated daily on week days.
Initial download of the metrics may take a while.