Free Access
Fig. 1.
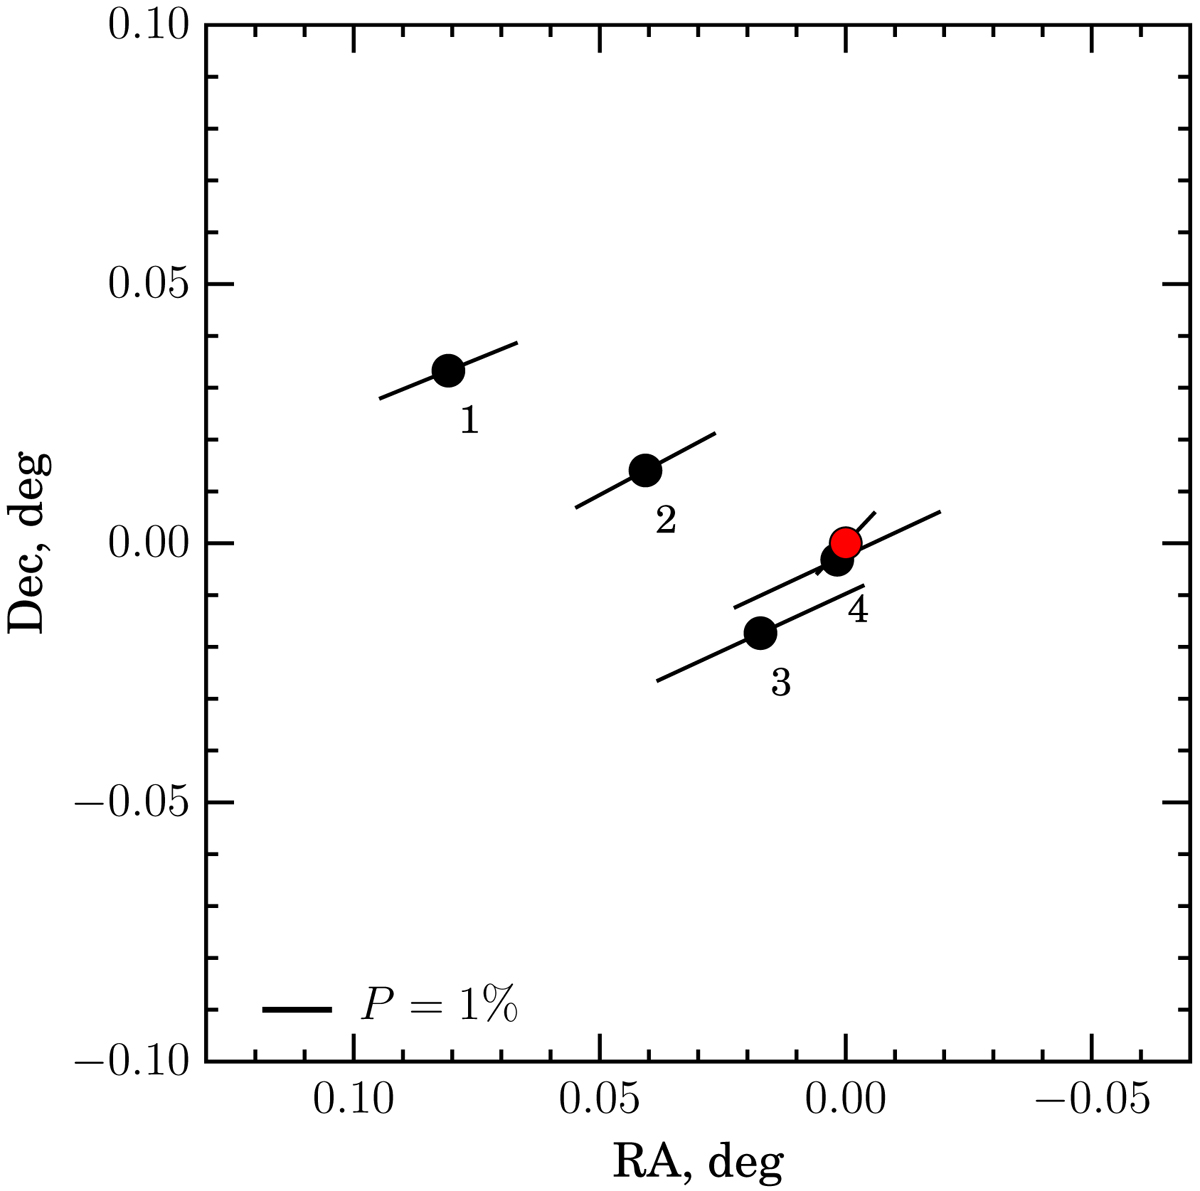
Polarization map of LS I +61° 303 (red circle at the origin) and field stars (black circles) in the R band. The length of the bars corresponds to the degree of linear polarization P, and the direction corresponds to the PA θ (measured from the north to the east).
Current usage metrics show cumulative count of Article Views (full-text article views including HTML views, PDF and ePub downloads, according to the available data) and Abstracts Views on Vision4Press platform.
Data correspond to usage on the plateform after 2015. The current usage metrics is available 48-96 hours after online publication and is updated daily on week days.
Initial download of the metrics may take a while.