Fig. 9.
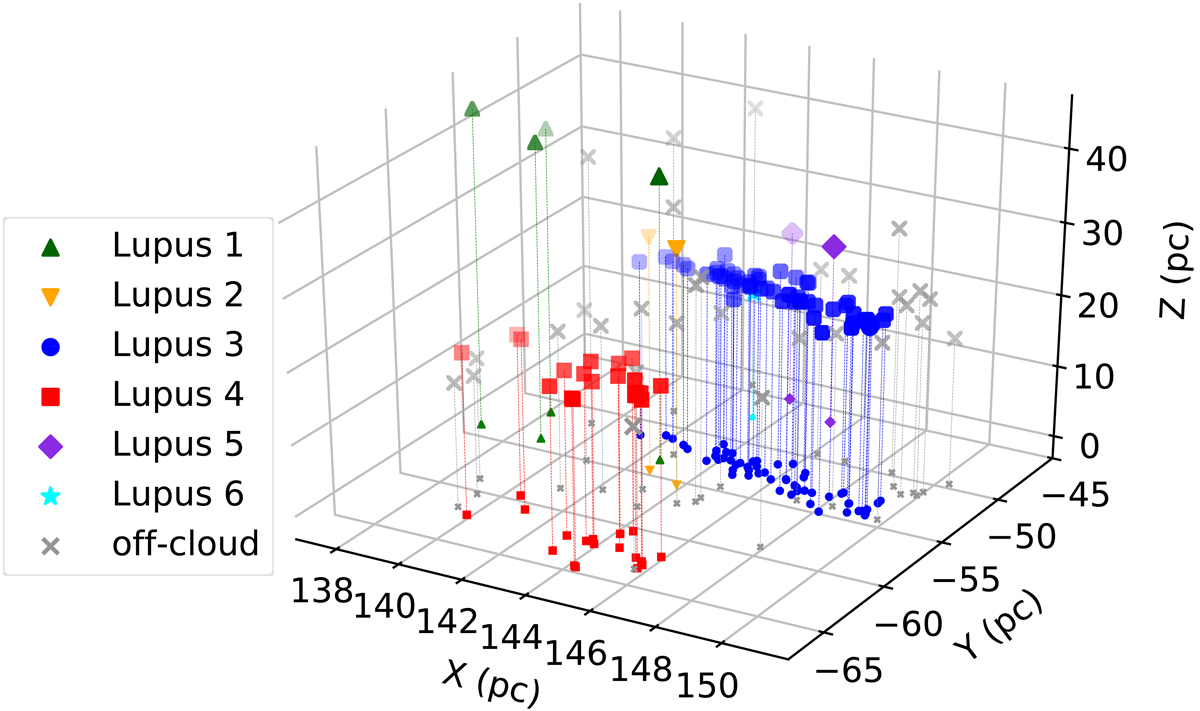
3D spatial distribution of the 113 members of the Lupus association. The different colours denote the various subgroups of the Lupus star-forming region. The dashed lines connect each point in the plot to its projection on the XY plane (with Z = 0). The reference system used to represent the 3D spatial distribution of the stars is the same as described in the text of Sect. 4.4.
Current usage metrics show cumulative count of Article Views (full-text article views including HTML views, PDF and ePub downloads, according to the available data) and Abstracts Views on Vision4Press platform.
Data correspond to usage on the plateform after 2015. The current usage metrics is available 48-96 hours after online publication and is updated daily on week days.
Initial download of the metrics may take a while.