Fig. 10.
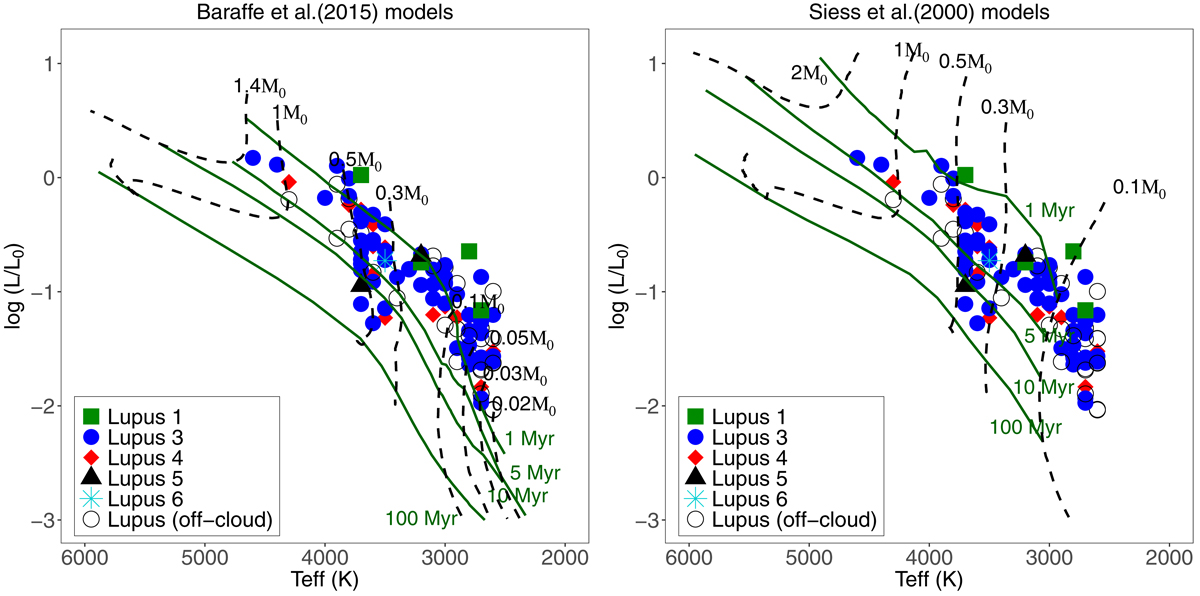
HR diagram of the Lupus star-forming region with the Baraffe et al. (2015) and Siess et al. (2000) evolutionary models. The solid and dashed lines represent isochrones and tracks, respectively, with the corresponding ages (in Myr) and masses (in M⊙) indicated in each panel. The most massive star in our sample (HR 5999) is not shown to improve the visibility of the low-mass range that includes the other stars in our sample. The error bars are smaller than the size of the symbols.
Current usage metrics show cumulative count of Article Views (full-text article views including HTML views, PDF and ePub downloads, according to the available data) and Abstracts Views on Vision4Press platform.
Data correspond to usage on the plateform after 2015. The current usage metrics is available 48-96 hours after online publication and is updated daily on week days.
Initial download of the metrics may take a while.