Fig. 7
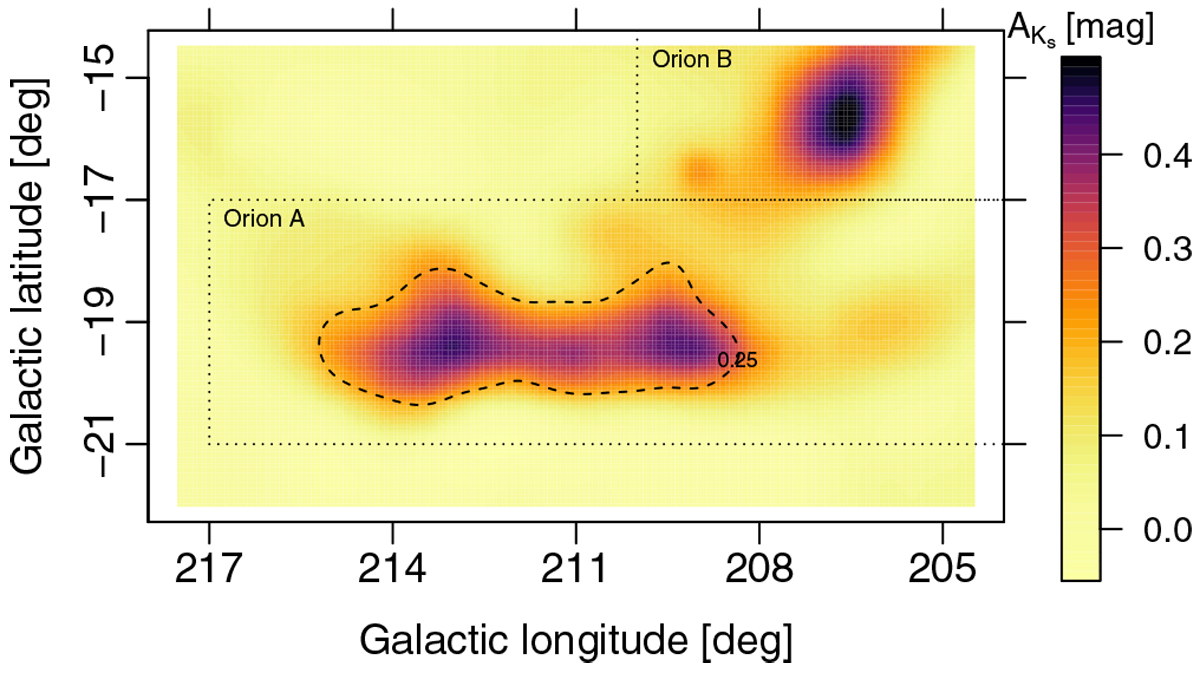
Reconstructed extinctions up to 600 pc using the predicted dust densities. The plot is made by summing the predicted densities in each distance grid along each l.o.s, multiplied by the grid size (10 pc here). The Orion A filament and part ofOrion B are nicely recovered by the predictions. The dashed contour represents the 0.25 mag extinction threshold from the Green et al. (2019) extinction map, smoothed to the same resolution as our map. The boundaries of Orion A andOrion B are marked by dotted lines from the Lombardi et al. (2011) extinction map as a reference too. For illustration purposes the image is smoothed as explained in Fig. 1.
Current usage metrics show cumulative count of Article Views (full-text article views including HTML views, PDF and ePub downloads, according to the available data) and Abstracts Views on Vision4Press platform.
Data correspond to usage on the plateform after 2015. The current usage metrics is available 48-96 hours after online publication and is updated daily on week days.
Initial download of the metrics may take a while.