Fig. 6
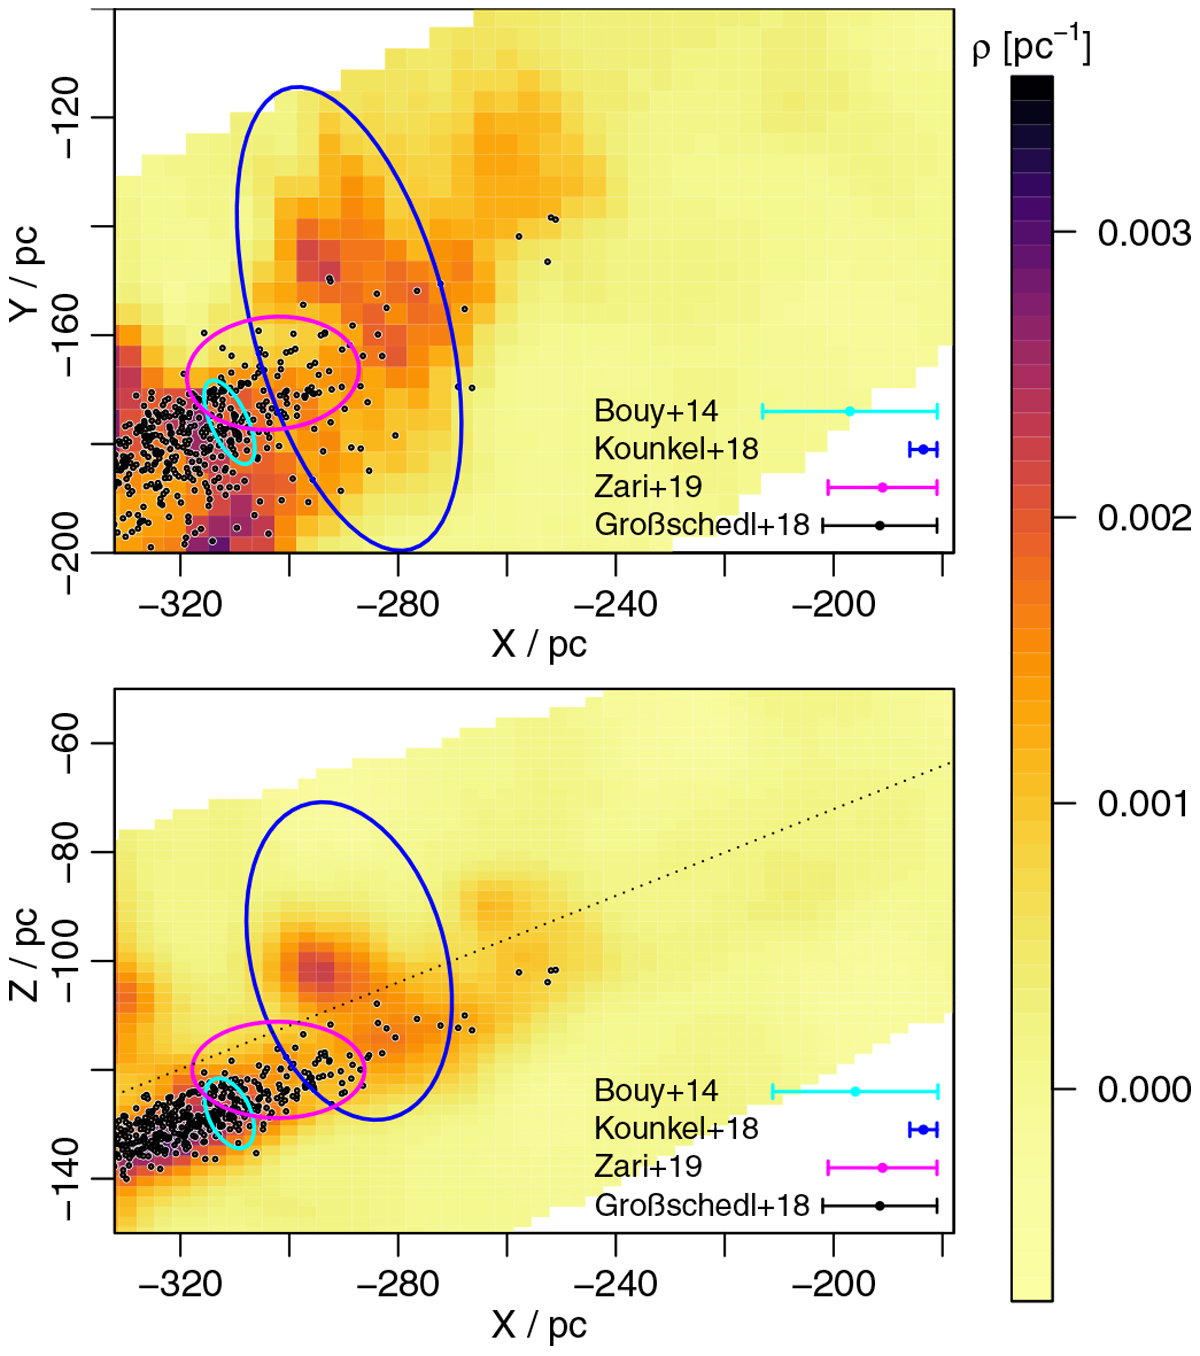
Sameas Fig. 1 zoomed in to the location of the foreground cloud, with stellar associations over-plotted. The cyan, magenta, and blue ellipses represent the location of stellar populations from Bouy et al. (2014), Zari et al. (2019), and Kounkel et al. (2018) respectively. The black dots are YSOs from Großschedl et al. (2018). Each group has stars with different l, b, and distance that make them appear within their corresponding ellipse on these plots, therefore, the size of each ellipse shows the distribution of stars in the 3D space. The error bars on the bottom right corner of thepanels illustrate the error on the centre position for the groups shown by ellipses, and the typical uncertainty for the individual stars in Großschedl et al. (2018). The dotted line in the lower panel represents the limiting latitude of the YSO survey.
Current usage metrics show cumulative count of Article Views (full-text article views including HTML views, PDF and ePub downloads, according to the available data) and Abstracts Views on Vision4Press platform.
Data correspond to usage on the plateform after 2015. The current usage metrics is available 48-96 hours after online publication and is updated daily on week days.
Initial download of the metrics may take a while.