Open Access
Fig. 5
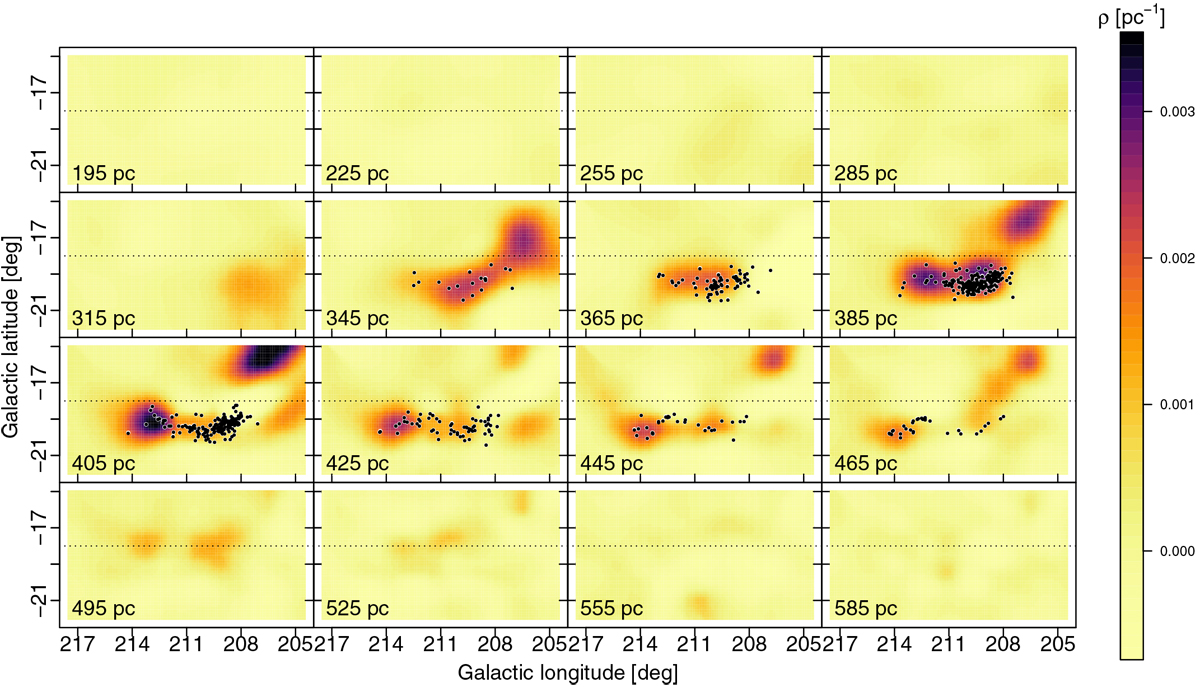
Same as Fig. 2 with YSOs of Großschedl et al. (2018) over-plotted as black circles. For each distance panel, we selected YSOs within 5 pc of the slice. The YSOs follow our dust pattern quite well. The dotted line indicates the limit of the YSO survey in latitude.
Current usage metrics show cumulative count of Article Views (full-text article views including HTML views, PDF and ePub downloads, according to the available data) and Abstracts Views on Vision4Press platform.
Data correspond to usage on the plateform after 2015. The current usage metrics is available 48-96 hours after online publication and is updated daily on week days.
Initial download of the metrics may take a while.