Fig. 4
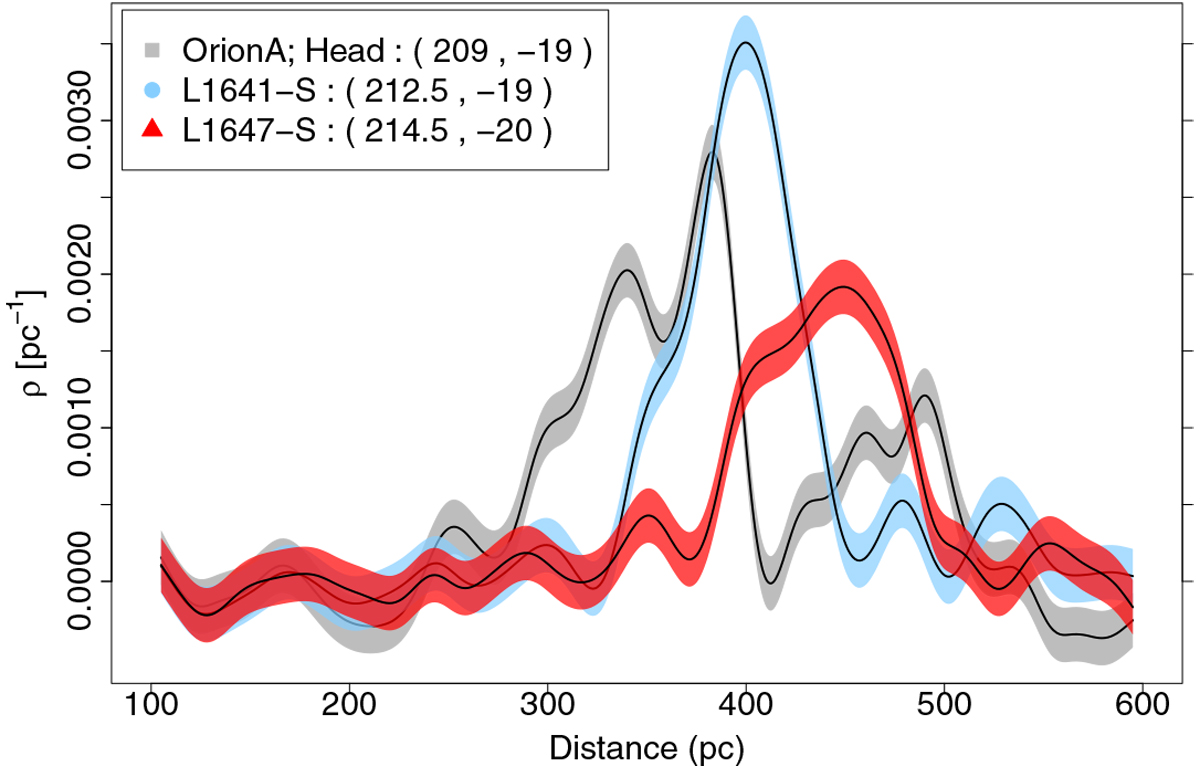
Same as Fig. 3 but for three other l.o.s; one towards the Orion A head (in grey), another one towards the middle of the filament, at the location of the L1641-S cluster (in blue), and the third one towards the tail of Orion A and at the location of the L1647-S cluster (in red). The projected sight lines are over-plotted on Fig. 2 as a reference.
Current usage metrics show cumulative count of Article Views (full-text article views including HTML views, PDF and ePub downloads, according to the available data) and Abstracts Views on Vision4Press platform.
Data correspond to usage on the plateform after 2015. The current usage metrics is available 48-96 hours after online publication and is updated daily on week days.
Initial download of the metrics may take a while.