Fig. 3
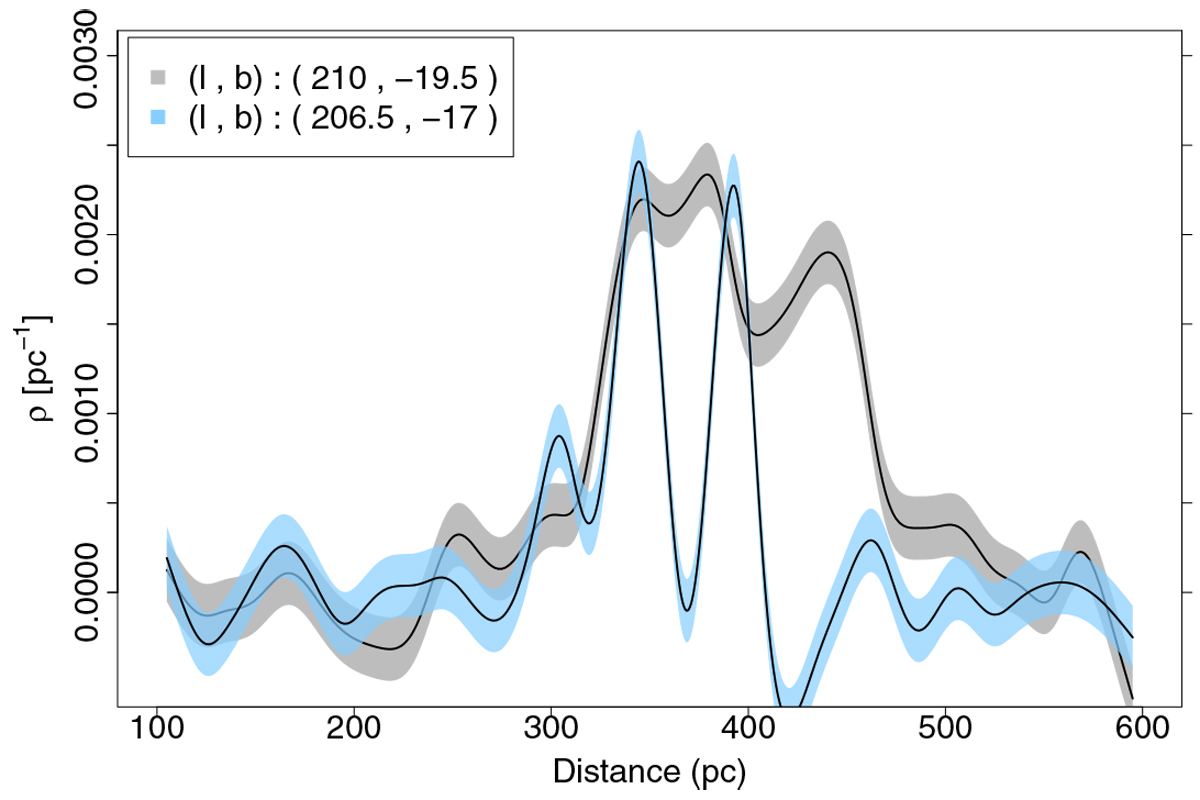
Dust density vs. distance for two different l.o.s. towards upper (blue shades) and lower (grey shades) parts of the foreground structure (over-plotted on Fig. 1). The black line shows the mean and the shades represent one standard deviation (also computed by the Gaussian process model). The grey-shaded first peak represents the foreground cloud while it seems to be connected to the main cloud in the background (the second peak). The two blue peaks illustrate the front and back edges of the foreground cloud.
Current usage metrics show cumulative count of Article Views (full-text article views including HTML views, PDF and ePub downloads, according to the available data) and Abstracts Views on Vision4Press platform.
Data correspond to usage on the plateform after 2015. The current usage metrics is available 48-96 hours after online publication and is updated daily on week days.
Initial download of the metrics may take a while.