Fig. 2
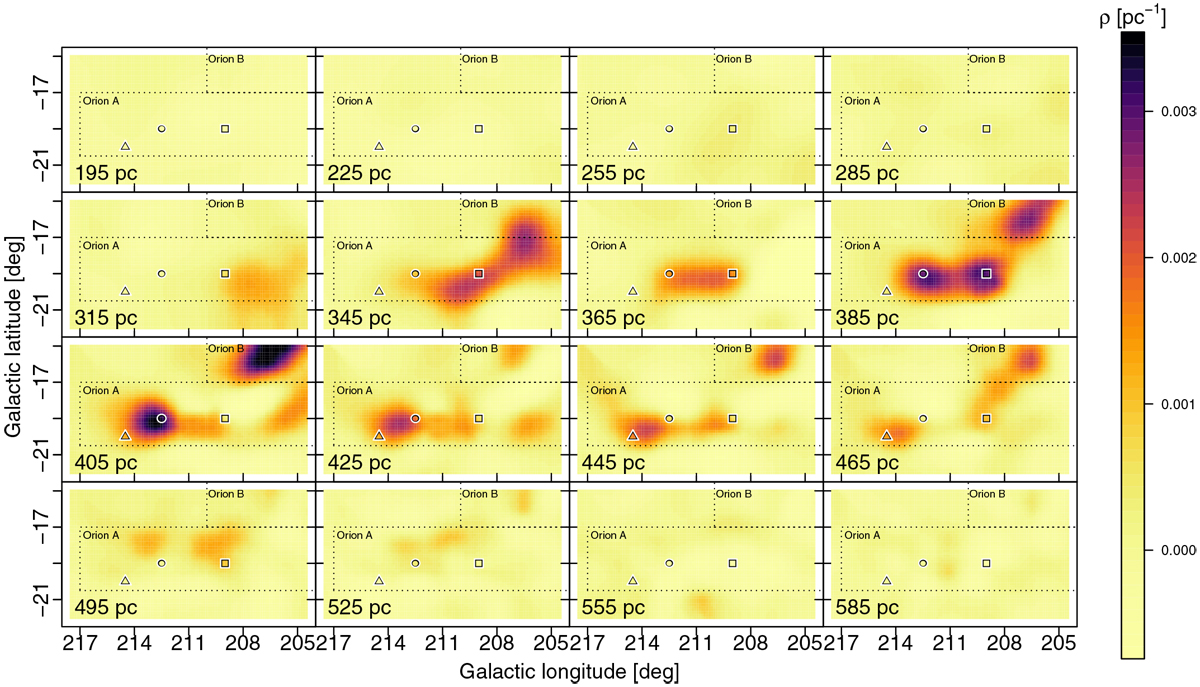
Dust density predictions on the plane of sky. Each panel represents a slice through the cloud at fixed distances (every 30 pc at closer distances and 20 pc around the main structure). The presence of the foreground cloud to Orion A is evident at the 345-pc panel. The tail of Orion A (around l = 213, b = −19) appears in multiple panels, illustrating the extent of the cloud to larger distances. The over-density at about 400 pc and higher latitude belongs to the lower part of Orion B. The boundaries of Orion A and Orion B in the sky projection are shown by dotted lines (Lombardi et al. 2011). The three symbols (square, circle, and triangle) represent specific l.o.s along the Orion A filament investigated in Fig. 4. For illustration purposes, the image is smoothed with the scale length of 0.4 degrees (see Fig. 1 for more details of the plotting method).
Current usage metrics show cumulative count of Article Views (full-text article views including HTML views, PDF and ePub downloads, according to the available data) and Abstracts Views on Vision4Press platform.
Data correspond to usage on the plateform after 2015. The current usage metrics is available 48-96 hours after online publication and is updated daily on week days.
Initial download of the metrics may take a while.