Fig. 12
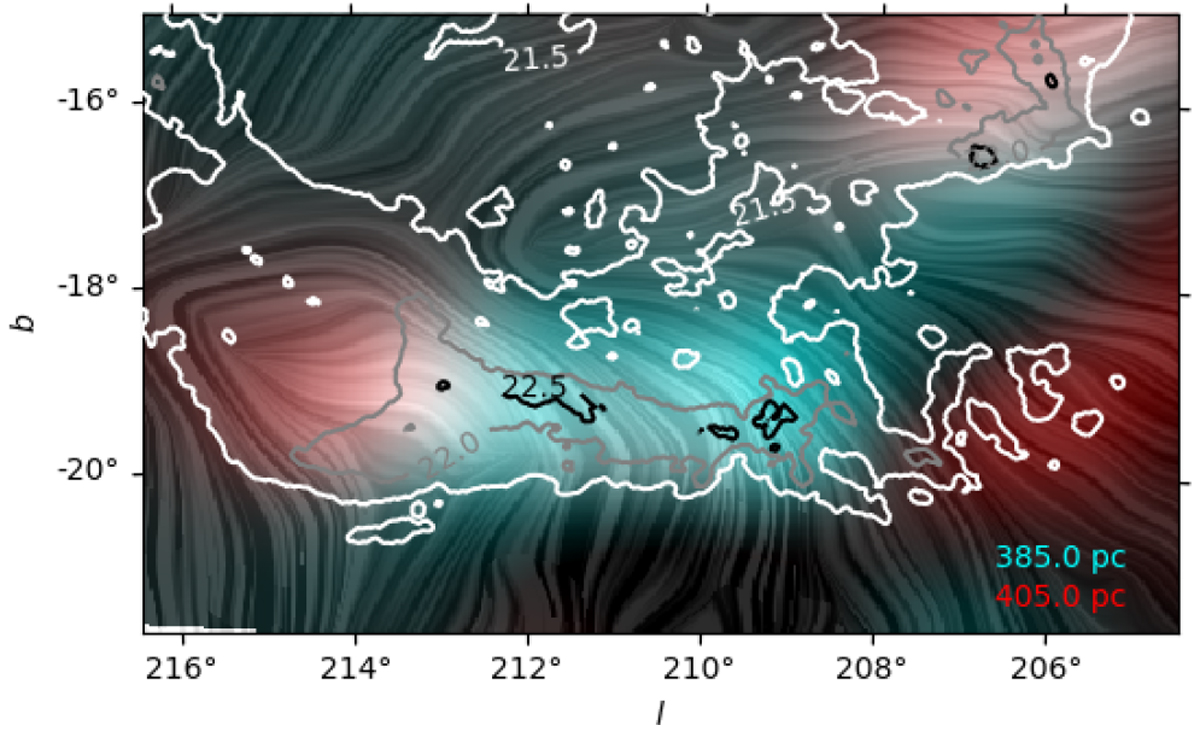
Extinction in the 30-pc slabs around the distances 385 and 405 pc, shown in red and cyan as a two-colour image. Overlap in the extinction in the two slabs is shown by the brighter colour between cyan and red (e.g. around l = 213°, b = −19°). The contours correspond to the logarithm of the dust column densities inferred from the Planck observations,
![]() . The drapery pattern corresponds to the orientation of the plane-of-the-sky magnetic field orientation inferred from the
Planck 353-GHz polarization observations.
. The drapery pattern corresponds to the orientation of the plane-of-the-sky magnetic field orientation inferred from the
Planck 353-GHz polarization observations.
Current usage metrics show cumulative count of Article Views (full-text article views including HTML views, PDF and ePub downloads, according to the available data) and Abstracts Views on Vision4Press platform.
Data correspond to usage on the plateform after 2015. The current usage metrics is available 48-96 hours after online publication and is updated daily on week days.
Initial download of the metrics may take a while.