Fig. 1
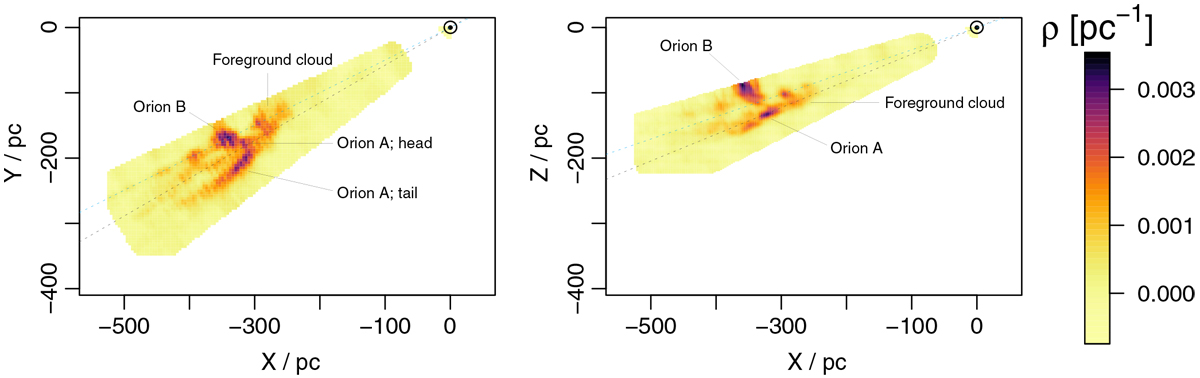
Two Cartesian projections of the 3D dust distributions in Orion. The Sun is at (X, Y, Z) = (0, 0, 0), with X increasing towards the Galactic centre and Z pointing to the north Galactic pole, perpendicular to the Galactic disk. Left panel: looks through the Galactic plane from north to south and right panel: perpendicular to that of the left, having the Galactic height as the vertical axis. The presence of the foreground bubble structure is evident in both projections. Also the extent of the tail of Orion A to large distances is clearly seen from the left panel. The dashed lines are two l.o.s passing through different parts of the foreground cloud analysed further in Fig. 3. The predictions are made on regular grids for every 0.5 degrees in the Galactic l and b, and every 10 pc in distance. The 2D image is then produced by applying a smoothing kernel (with 4-pc scale length) to handle the missing pixels. In order not to produce extra smoothing than that of the method, the length scale of the kernel is chosen to be relatively small; hence, the distance gridding is still apparent in the left panel.
Current usage metrics show cumulative count of Article Views (full-text article views including HTML views, PDF and ePub downloads, according to the available data) and Abstracts Views on Vision4Press platform.
Data correspond to usage on the plateform after 2015. The current usage metrics is available 48-96 hours after online publication and is updated daily on week days.
Initial download of the metrics may take a while.