Free Access
Fig. 5.
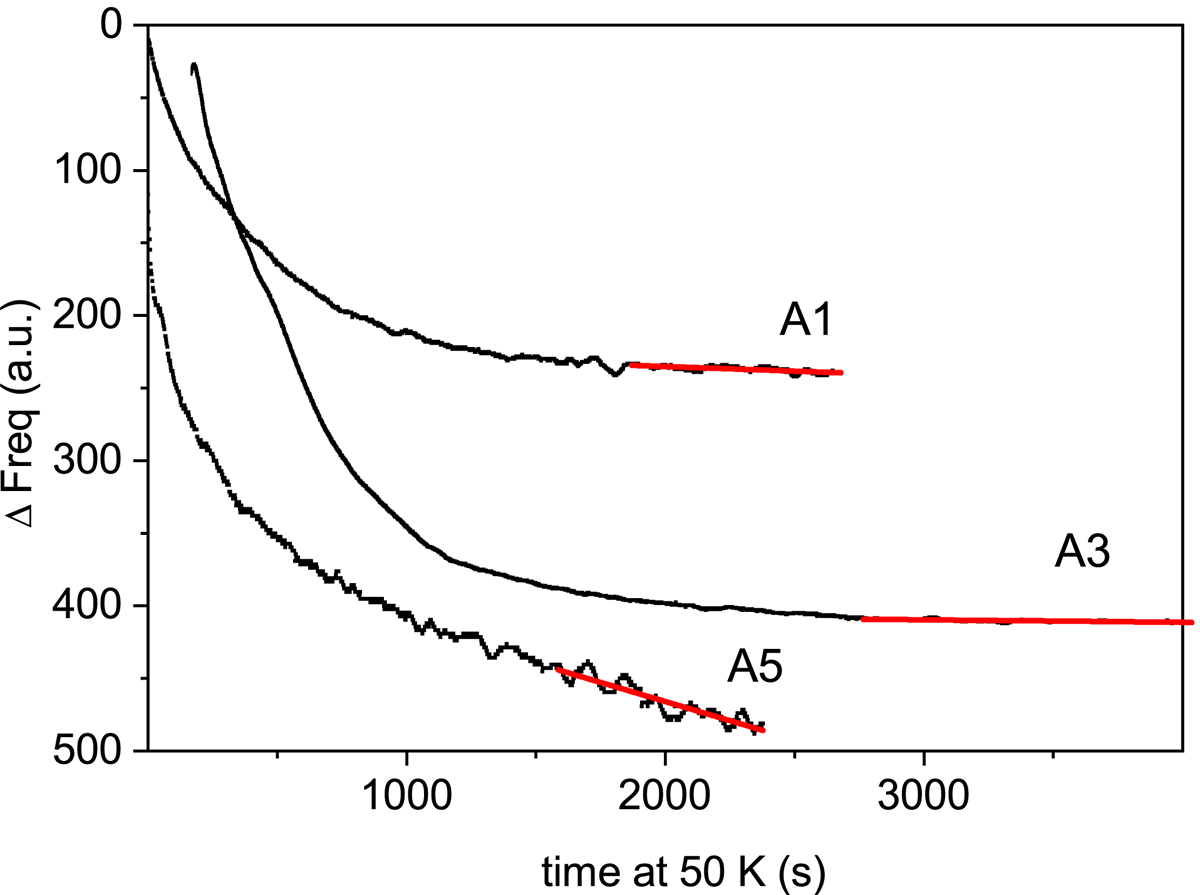
Diffusion of methane from ASW ice grown at 30 K. QCMB signal variation versus time elapsed at 50 K. Black lines: experimental data. Red lines: linear fit employed to derive diffusion coefficients from Fick’s first law.
Current usage metrics show cumulative count of Article Views (full-text article views including HTML views, PDF and ePub downloads, according to the available data) and Abstracts Views on Vision4Press platform.
Data correspond to usage on the plateform after 2015. The current usage metrics is available 48-96 hours after online publication and is updated daily on week days.
Initial download of the metrics may take a while.