Free Access
Fig. 4.
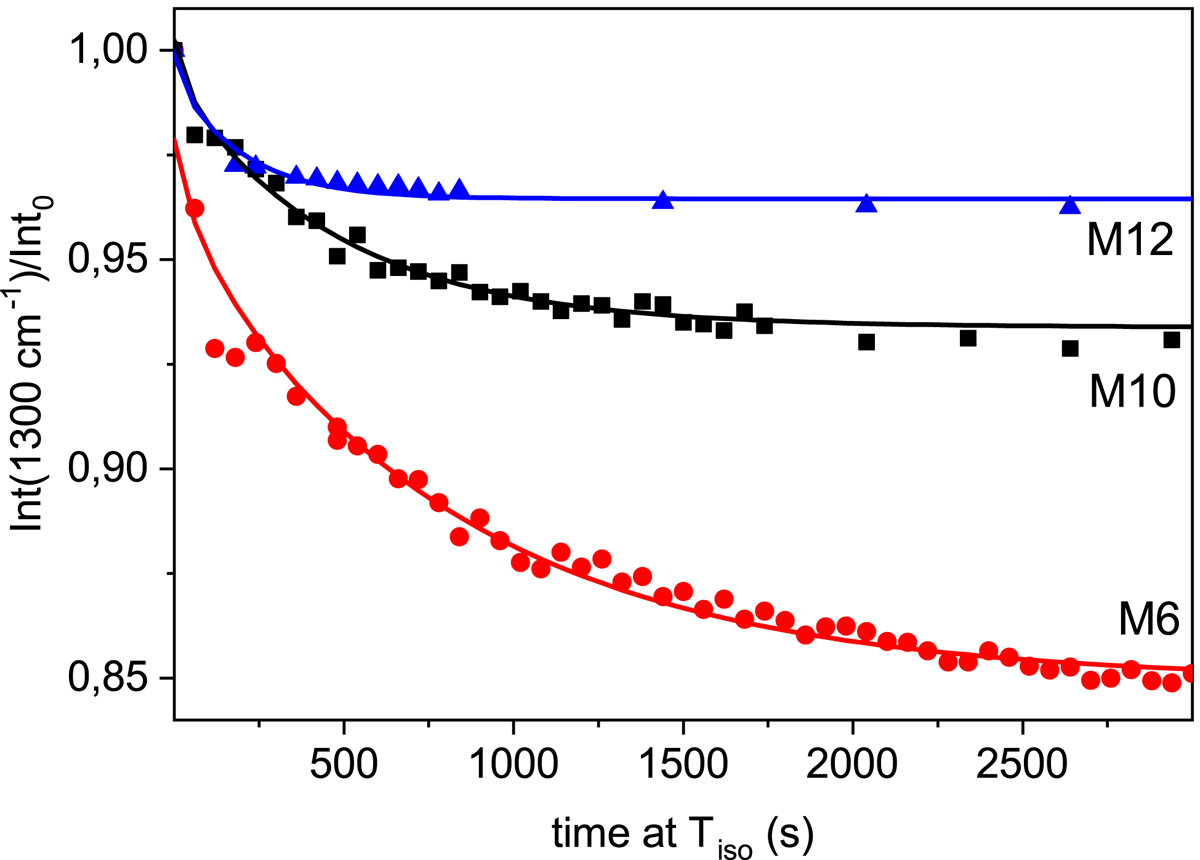
Normalised decay of the intensity of the 1300 cm−1 band of CH4 versus time elapsed at 50 K, 55 K, and 60 K. Scatter points: experimental data. Lines: fit to the second Fick diffusion law.
Current usage metrics show cumulative count of Article Views (full-text article views including HTML views, PDF and ePub downloads, according to the available data) and Abstracts Views on Vision4Press platform.
Data correspond to usage on the plateform after 2015. The current usage metrics is available 48-96 hours after online publication and is updated daily on week days.
Initial download of the metrics may take a while.