Fig. 8
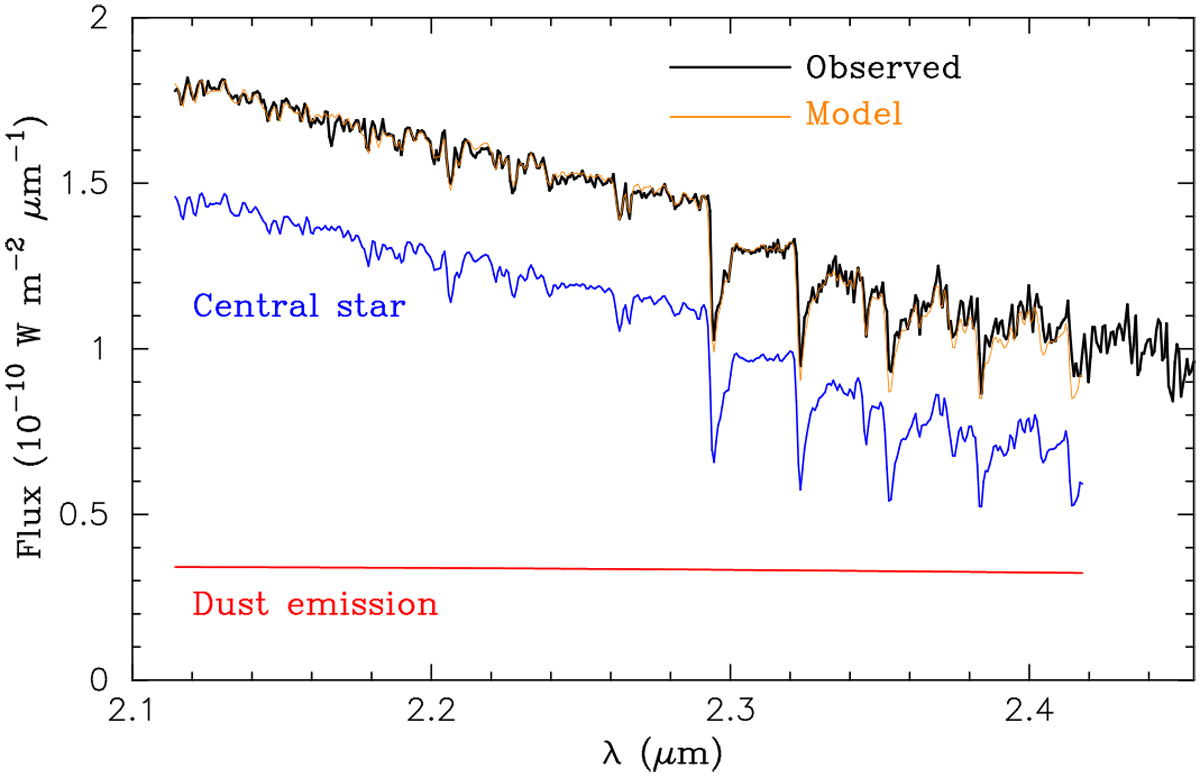
Fitting to the observed spectrum of HR3126 with the central star and dust emission components. The solid black and orange lines represent the spectrum obtained with AMBER and the model spectrum, respectively. The flux of the central star and dust at the inner rim (with a dust temperature of 1400 K) predicted by the model is shown with the solid blue and red lines, respectively. The model spectra are calculated only up to 2.42 μm, beyond which the IRTF spectrum of the proxy star of HR3126 is not available.
Current usage metrics show cumulative count of Article Views (full-text article views including HTML views, PDF and ePub downloads, according to the available data) and Abstracts Views on Vision4Press platform.
Data correspond to usage on the plateform after 2015. The current usage metrics is available 48-96 hours after online publication and is updated daily on week days.
Initial download of the metrics may take a while.