Fig. 7

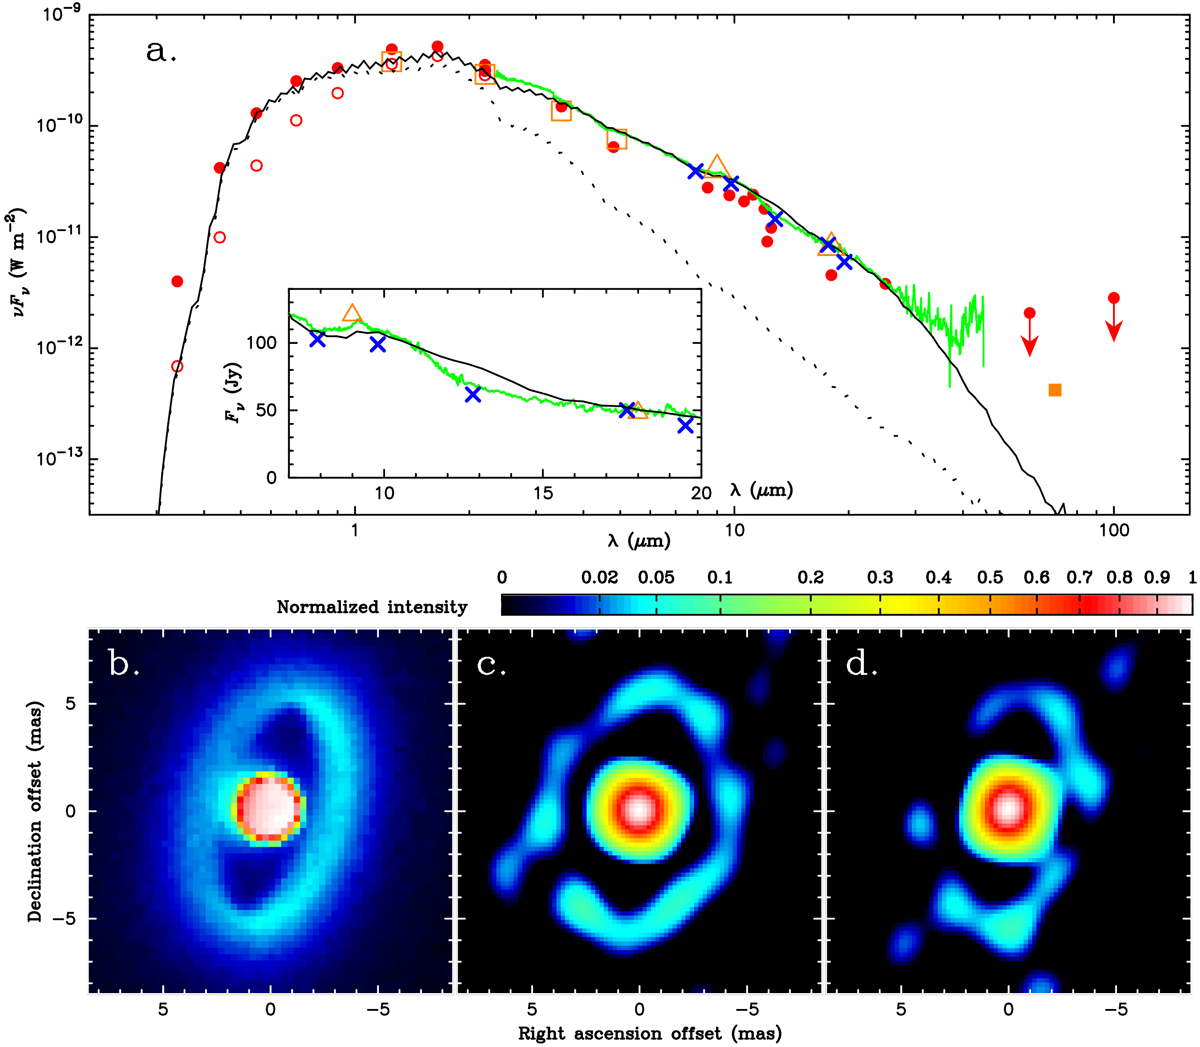
Radiative transfer modeling of the observed SED and continuum image of HR3126. (a) Comparison of the SED between the best-fit model and the observed data. The solid black line and the dotted line represent the total flux and stellar flux predicted by the best-fit model, respectively. Filled circles show the photometric data compiled in Chiar et al. (1993), which we dereddened with AV = 1.18 and RV = 3.1 (Sect. 2). The original data from Chiar et al. (1993) without dereddening are plotted with the open circles (data points longward of 3 μm are not shown because the reddening is negligible). The data taken with COBE/DIRBE, AKARI, and Hershel/PACS are plotted with the open squares, open triangles, and filled square, respectively. The solid green line represents the ISO/SWS spectrum. The blue crosses show the VISIR measurements of the present work (Sect. 4.2). The inset shows an enlarged view of the mid-infrared wavelength region. (b) 2.2 μm image predicted by the best-fit model. (c) Image reconstructed from the simulated interferometric data generated from the best-fit model image. (d) Image reconstructed at 2.25 μm in the continuum shown in Fig. 4c. The images in panels b, c, and d are not convolved with a beam.
Current usage metrics show cumulative count of Article Views (full-text article views including HTML views, PDF and ePub downloads, according to the available data) and Abstracts Views on Vision4Press platform.
Data correspond to usage on the plateform after 2015. The current usage metrics is available 48-96 hours after online publication and is updated daily on week days.
Initial download of the metrics may take a while.


