Free Access
Fig. 6
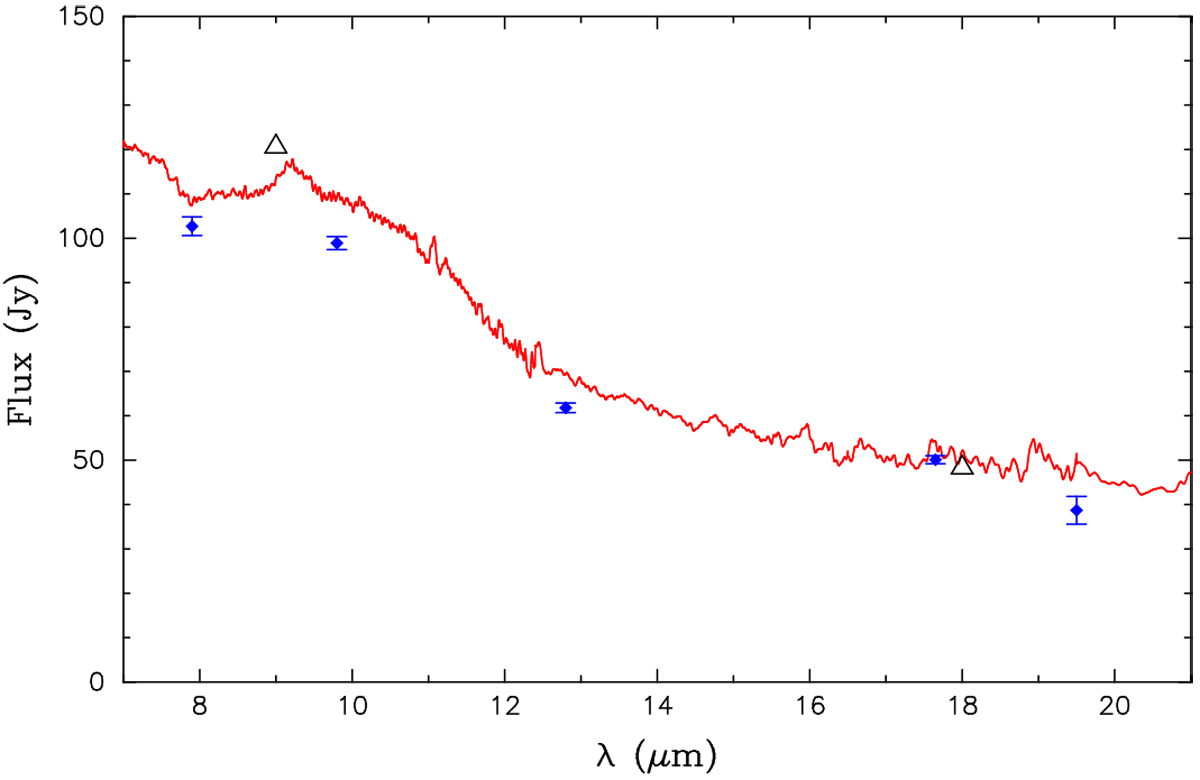
Mid-infrared observations of HR3126. The diamonds with the error bars represent our VISIR measurements, while the solid line represents the ISO/SWS spectrum. The AKARI measurements are plotted with the open triangles.
Current usage metrics show cumulative count of Article Views (full-text article views including HTML views, PDF and ePub downloads, according to the available data) and Abstracts Views on Vision4Press platform.
Data correspond to usage on the plateform after 2015. The current usage metrics is available 48-96 hours after online publication and is updated daily on week days.
Initial download of the metrics may take a while.