Fig. 5
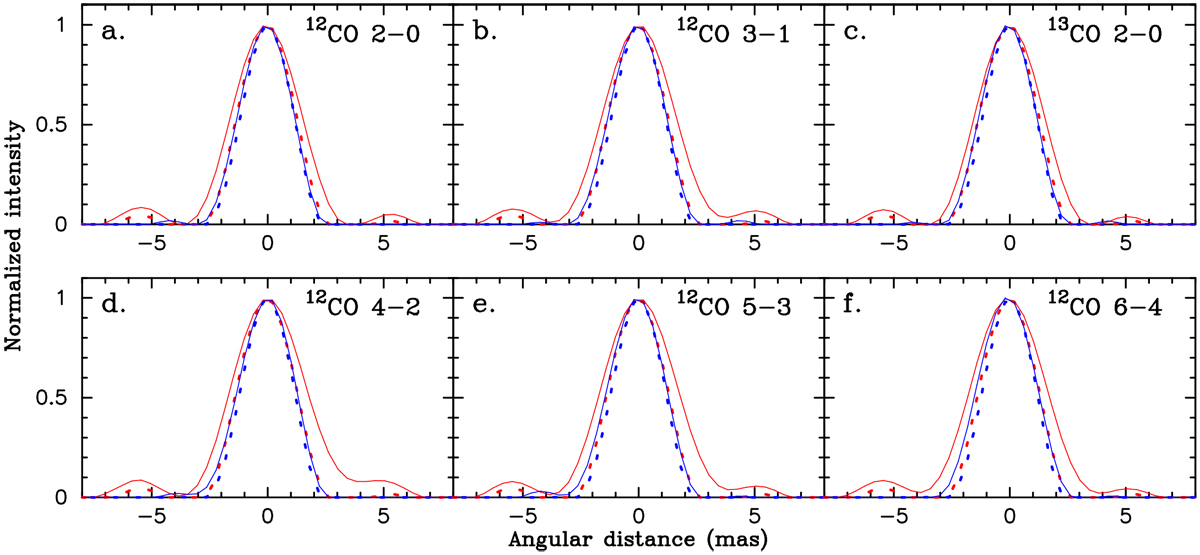
Intensity profiles of the (unconvolved) reconstructed images of HR3126 in the CO band heads at two orthogonal position angles. In each panel, the solid red and blue lines represent the intensity profiles in the corresponding CO band head at position angles of 170° (approximately N–S direction) and 80° (roughly E–W direction), respectively. The dotted red and blue lines represent the intensity profiles at 2.25 μm in the continuum at position angles of 170° and 80°, respectively,and they are the same in all panels.
Current usage metrics show cumulative count of Article Views (full-text article views including HTML views, PDF and ePub downloads, according to the available data) and Abstracts Views on Vision4Press platform.
Data correspond to usage on the plateform after 2015. The current usage metrics is available 48-96 hours after online publication and is updated daily on week days.
Initial download of the metrics may take a while.